"Virtual Moon Atlas Version 7"
Documentation for ATLUN (c) module
May 2020
Welcome to the "Virtual Moon Atlas Version 7"
Having
devoted 4 years of development to the first two versions of the
"Virtual Planets Atlas" (http://www.ap-i.net/avp/fr/start) we had
temporarily stopped developing VMA. But today, new data having been
collected by an army of new lunar probes, we have the "material" to
release a new version. We are happy to present to you now after three
years of development the two new issues of the "Virtual Moon Atlas Version 7":
The Version 7.0 is usable on Windows computers
with powerful configurations with high resolution textures, large
databases, scientific layers, bi-windowing, "full screen" and double
screen display, as well as dynamic shadows on the terminator.
This version can be
downloaded free of charge from the VMA website. They can be
supplemented by the numerous image libraries which can also be
downloaded free of charge from the VMA website.
Please note that
we have abandoned the development of the MacOs version of VMA, given
the increasing complexity of adapting graphics cards to Apple computers
(c). It seems that VMA can be run under Wine, Paralells or Crossover emulators.
Also,
we stop the Linux version development since we encouter technical
difficulties and that we know that the windows version runs well with
Wine emulator on Linux.
Please also note that since Windows XP (c) is absolutely no longer supported by Microsoft (c), we no longer provide installation packages for this OS.
WINDOWS "SD" CARD VERSION
We
chose the SD card as the new distribution medium because of its large
capacity with maximum compactness. In addition, the user can re-use
this medium for personal purposes.
You can order "SD" versions
from the VMA website if you want to support us or because you do not
have a fast internet connection or if you prefer a quick and convenient
installation.
This version can be used with powerful
configurations. The SD contains the Windows version with an installation program, all modules,
all textures up to level L6, all scientific layers and several public domain
image libraries (LOPAM, Apollo, Apollo Mapping, LAC / LM, Clementine
and Consolidated Lunar Atlas).
This SD version can be
completed with high resolution textures and others non public images libraries (Best
of Amateurs, Best of Peach, Best of Cathala, Best of Pic du Midi,
Kaguya ...) also downloadable for free from the website VMA, if you
want to make the program even more efficient.
WHY THIS MANUAL?
Even
if VMA is relatively easy to access, this manual is necessary to
discover all of the possibilities of the ever-increasing software. We advise you to read it carefully while at the same time practicing the functions described.
Good use and we hope you enjoy this program and recommend it around you.
Thank you all for your trust which has enabled us to continue developing the Atlas for 18 years !
Christian Legrand & Patrick Chevalley

The authors at full work ! In the foreground P. Chevalley and in the background C. Legrand
_____________________________________________________________________________________________________________________
DOCUMENTATION
MODULES OF THE VIRTUAL MOON ATLAS VERSION 7.0
The "Virtual Moon Atlas" version 7 currently includes 4 modules:
- The "ATLUN" (c) module : it is the mapping module which is the basic module of the VMA. This manual describes its functionality.
- The "DATLUN" (c) module : it is the database management module which has particularly powerful sorting functions. It has its own manual.
- The "PHOTLUN"(c) module : this is the image library management module which has particularly powerful processing functions. It has its own manual.
- The "WEBLUN" (c) module : this is the database management module which has particularly powerful sorting functions. It has its own manual.
These modules are launched from the “VMA COMMAND CENTER”
THE "COMMAND CENTER"
The "VMA COMMAND CENTER" presents buttons that can start every VMA modules or the documentations.

The "VMA COMMAND CENTER" screen presents 7 buttons usable today :
Atlun : To start the lunar mapping software
DatLun : To start the lunar formations databases manager
WebLun : To start the lunar Web sites manager
PhotLun : To start the pictures libraries manager
Documentation : To open the present documentation
Tutoriel : To open the VMA tutorial
Quitter : To exit the VMA
THE "ATLUN MODULE" SCREEN

Left : New texture "LOLA-Kaguya shaded"
Right : New texture "USGS Geological 2020"
For this new version 7.0, we have modernized the display of the main window with a new set of icons, new buttons, an adaptation to dark Windows (c) themes and now retractable tabs. It is also possible to split the window display on two independent monitors.
"ATLUN" screen appears in a "Microsoft Windows style" window. As you can see, the aspect is also the same on MacOS.
As usual, you can minimize or maximize the window, or
choose its size with the buttons in the title bar, on right.
You can open simultaneously two map windows, permitting maps comparisons as on the picture above. It's also possible to open the window of "DATLUN" (c), WEBLUN (c) and "PHOTLUN" (c).
Main window presents:
- Menus and buttons bar
- Map window that can be cut in two map windows as above
- tabs "Information", "Ephemerisis", "Notes",
"Tools", "Settings" and "Terminator" and
the associated windows.
- Status bar with lots of information displayed in real time.
VMA can use dark Windows themes to limit glare or for simple aesthetic reasons


This bar presents menus to access different functions and buttons to quick launch of some other useful functions.
THE "FILE" MENU

Traditional in all Windows softwares, this menu is used here to open DATLUN (c), save screen pictures, to setup printing, to launch Patrick Chevalley's freeware "Sky Charts" if it's installed on your computer, and to quit the atlas.
"Databases" FUNCTION
This function opens a new window containing VMA database manager DATLUN
"Snapshot" FUNCTION
This function can open a new small window containing a map window capture. You can compare this capture with a new configuration applied to the map window.
"Save as" FUNCTION
This function permits you to save the "Map" window as a .jpg or a .bmp file
"Printer setup" FUNCTION
This function permits you, with the use of the regular window selection, to choose your printer and to setup it.
"Save ephemeris to file" FUNCTION
This function allows you to save in a file "ephem.csv". It opens a window for choosing the deadlines, the recording step and the file saving directory. The "Compute" button creates the file from the specified dates and times. The button to the right of the "File" field allows you to choose the recording directory.

"Print" FUNCTION
This function allows you to print the documents you chose in the printed documents (Map, ephemeris and / or information page).
"Sky chart" FUNCTION
This option is used to launch Patrick Chevalley's freeware "Sky Charts"
to determine Moon position according to stars and horizon. It can help
you for star occultations for example.
"Quit FUNCTION
You can leave the software using this option, closing all the open windows together.
THE "CONFIGURATION" MENU
This menu is used to adjust different parameters in VMA. It presents eight tabs
"General" tab
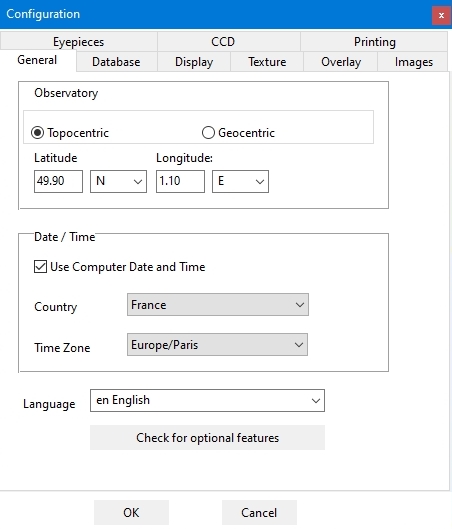
Observatory coordinates
Selecting "Geocentric coordinates", you will see the lunar
globe as if you were positioned on the line joining the center of the
Earth to the center of the Moon.
The software can instead use coordinates of your observing site to display
a real time lunar disk with computations including diurnal libration.
To do this, you have to de-activate "Geocentric coordinates" (uncheck
it) and input the latitude and longitude of your observing
site.
Input also the time shift from GMT including eventual "summer time" in the "Time zone" field.
"Date / Hour" frame
The "Date / Hour" frame is used to precise the hour and the time zone to use.
Filling the box "Use computer hour and time zone" so that VMA use the computer internal clock as a reference.
If you don't fill the box, you can specify your own time zone with the case displayed.
"Language" scrolling list
"Languages" scrolling list allows you to choose language used by the program and database. In this version, beyond French and English are now available in alphabetical order :
- Catalan
- Croatian
- Dutch
- German
- Greek
- Hungarian
- Italian
- Lituanian
- Slovenian
- Spanish
. You can also download from VMA Internet site, translations of words used in the menus in some other languages. Translation pages indicate if database translations are also available. You can also propose yoyrself to Patrick Chevalley if you are interested to translate VMA in your language if it's not yet done.
We would like th thank here the authors of the existing translations for their support to our action.
"Databases" tab
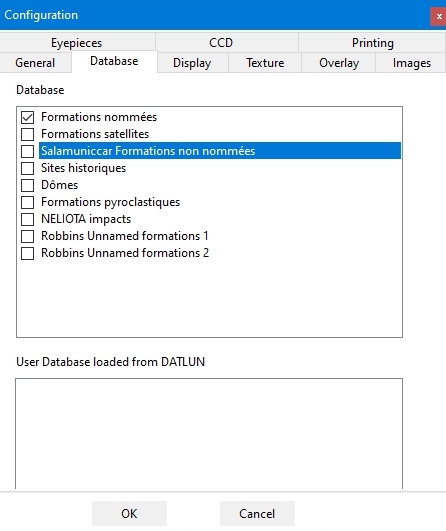
"Databases" boxes
The displayed databases are those automatically recognized by ATLUN.
"Databases" boxes allow you to choose the databases
used together by the software. Check only the one useful if your computer
is not too powerful.
When all databases are selected, VMA has more than 1 300 000 entries to manage.
New databases are constantly on work and are released with new VMA versions.
"Display" tab
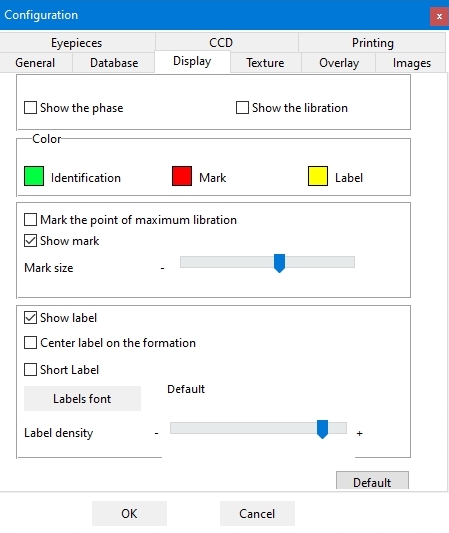
Display boxes
When clicking the "Show the phase" box, a penumbra zone is painted on the lunar globe. Its limit follows the terminator for the date and hour set by the user (See "Ephemerisis tab"). You can set the penumbra properties representation (See "Setup tab").
When clicking the "Show the libration" box, the lunar globe turns slightly so that it shows the effects of the global libration for the date and hour set by the user (See "Ephemerisis tab"). You can set the penumbra properties representation (See "Setup tab").
The libration display takes account of the latitude libration due to the Moon orbit inclination and of the longitude libration due to the Moon variable speed on its elliptical orbit. More, if you choose to input your observing site coordinates (See "Observatory coordinates")., the Moon globe will takes account also of the diurnal libration.
Colors
Clicking on the small colored squares allows you to choose colors
indicating point and formation name label displayed on map.
Labels and marks
Activating the corresponding boxes will make you display a point
showing the chosen formation and / or its official name
When clicking on the "Mark the point of maximum libration" box, an arrow is displayed on the lunar limb where libration effects are maximum.
Activating the corresponding boxes, you display the point (mark) showing the chosen formation, its official name, and the names of the other principal formations visible on the map.
You can choose to center or to place on the right of the formation when using or not the "Center label on formation" box.
The button "Labels font" can be used to setup font type, size and style. The active font name is displayed right to the button.
The slider "Label density" can be used to setup the number of names displayed. You will certainly have several tests to determine the best compromise. These button and slider are also used to setup map printing because the printed map is exact clone of the map displayed in the screen window.
"Textures" tab
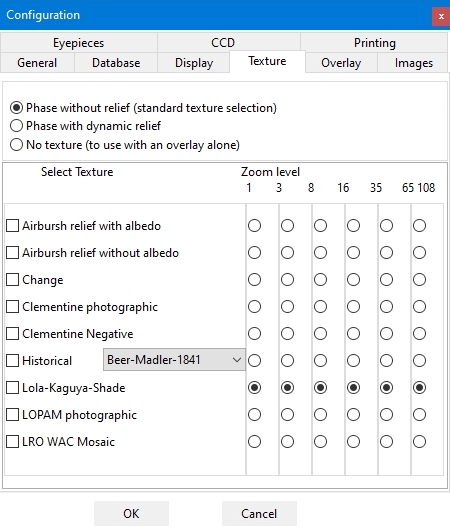
« Phases » frame
The three alternative boxes to check "Phase with relief", "Phase without relief" and "No texture" are used to choose whether or not to activate the dynamic display of shadows at the terminator:

Phase without "Dynamic shadows" display on the terminator

With display "Not texture", blank globe that can receive a single scientific layer

Phase with regular "Dynamic shadows" display on the terminator
This option gives a more realistic view, but doesn't permit a high power zoom.
The use of the new « Digital Elevation Model » coming fron LRO probe datas has improved the shadows on terminator compared to our previous DEL.
 .
.
Eyepiece field with special "LRO
dynamic shadows" display on the terminator.
You don't dream. This is a computer generated view, not a digital picture taken at the eyepiece of an instrument !
Beware : remind that it's not possible to use scientific overlays when using dynamic shadows.
This tab presents a matrix for selecting textures according to the
applied zoom level. This new function is a very useful way for choosing
the textures display.
The program will detect automatically which
textures are present (High Resolution or Very High Resolution) and will
permet access to the maximum zoom level available with them.
You can choose to keep the same texture for all zoom range or select as
above a progressive change parallel to the zoom change.
You have just to select the wished radio button. There can only have
one texture choosen for a given zoom level
If you don't want to see any texture, fill the "No texture / To use with an overlay alone"
We think that it's better to use textures with increasing resolutions
according to increasing zoom level. This is the choosen solution in the
above exemple.
There are 6 resolution levels for the texture. The software
loads automatically the levels indicated according to the zoom applied
to the map.
The USGS Geological La texture goes up to 3 level
The LRO, LOPAM, LRO-Kaguya and Chang’é 2 texture have 6 levels.
The textures "Airbrush with albedo", "Airbrush without albedo" show the details visible in amateur telescopes up to 200 mm in diameter.
The textures "Clementine photographic" and "Chang’é 2 photographique" are used to show the aspect of the formations under the highest possible solar lighting.
The "LRO-Kaguya" texture is particularly suitable for displaying scientific layers.
« Topographic textures » choice
The following screen captures show you the Alphonsus crater area with maximum possible zooming with each texture as in the above exemple. Six textures are available :
- "Aerographe with albedo" (USGS aerograph drawing realized from Clementine probe pictures with a uniform shadow, by David Seal from JPL and his team). In this "Expert" version, maximal resolution "Full" is 1 km / Pixel.

- "Airbrush relief map" (Aerograph drawing without albedo hues realized from Clementine probe pictures realized by US geological Survey / USGS team, copyright USGS / Astrogeology). Improved by ChristianLegrand. This texture reaches a definition of 500 m / pixel. It is now of less interest given the addition of the LOLA-Kaguya-Shaded texture (See below).

- "Clementine Photographic" (Mosaïc of Clementine probe pictures realized by professor Mark S. Robinson, and his team of "Northwestern University", copyright USGS / Astrogeology). This texture has a 200 m resolution. It's the most precise "albedo texture" presently available in computer lunar atlases. It's the only textures showing lunar formations without any shadow.

Important note : This texture has been built from Clementine original pictures treated by USGS. This is a remarkable work according to the amount of difficulties that have been encountered. This treatment can induce some formations distorsion at the borders of the plates. Also the position of some formations can be shifted slightly from its real place. We suggest you to confirm the exact aspect of a formation with the aerograph texture if you want to realize a precise survey..
- "Clementine Negative"
Mosaic
of original photographs of the Clementine probe produced by Professor
Mark S. Robinson, with his team from "Northwestern University",
copyright USGS / Astrogeology. The texture obtained was then "inverted". This texture reaches a definition of 200 m / pixel. It
is the only texture showing the "negative" formations, making it easier
to visualize certain formations, in particular the ejecta of craters or
recent craters.

- "Lunar Orbiter Photographic VHR / LOPAM" (Mosaïc of Lunar Orbiters 1, 2, 3, and 4 probes pictures based on new USGS realease, (copyright USGS). In this "Pro" version, this texture has a variable resolution that goes to 60 m/pixel resolution on the best places . It is a "texture with "shaded relief" benefiting from solar lighting at about 45 °.

Important note : This texture has been built from Lunar Orbiter original pictures that have been partially "destripped", redimensioned and rotated by USGS. This is a remarkable work according to the amount of difficulties that have been encountered. This heavy treatment can induce some formations distorsion at the borders of the plates. Also the position of some formations can be shifted slightly from their real place. We suggest you to confirm the exact aspect of a formation with the aerograph texture if you want to realize a precise survey.
- "Lunar Reconnaissance Orbiter Photographic VHR / LRO" : Mosaïc of original Lunar reconnaissance Orbiter pictures based on new USGS realease, (copyright USGS). In this "Pro" version, this texture has a variable resolution that goes to 60 m/pixel resolution on the best places . It's a "shaded relief texture" realized with a more vertical lighting than the previous LOPAM.

Important note : This texture has been built from Lunar Reconnaissance Orbiter original pictures. It has the very big advantage to be calibrated with the most precise lunar coordinates system available (Better than ULCN 2005) and this coordinates are also used in the new IAU lunar formations nomenclature now included in the VMA Pro 6 databases. So lunar formations are well centered with their labels on this texture.
- "Lunar Reconnaisance Orbiter - Kaguya Shaded"
Mosaic of the original images of the Lunar Reconnaissance Orbiter (USA) and Kaguya (Japan) probes from USGS data, copyright USGS. In this version 7, this texture has a variable resolution reaching 60 m / pixel in the best places. It is a "texture with shaded relief". It is not a photograph, it was established by computer from the altimetric data collected by the two probes to create a DEM (Digital Elevation Model). The initial texture only includes areas between -60 ° and + 60 ° latitude. Patrick Chevalley has reconstructed the polar zones from other LRO data.

This texture now advantageously replaces the "Aerograph ss albedo" texture.

"Aerograph ss albedo" "LOLA-Kaguya-Shaded"

Important note : This texture has been built from Chang'é 2 original pictures. This texture is not associated to the new lunar coordinates system of IAU. CNSA has brought very attention so that this mosaic will be the most precise possible with their own datas. Nevertheless, some formations labels can be slightly shifted from their image.
- "USGS Unified geological Map of the Moon" Compilation of datas collected by variuos probes on the age and composition of lunar terrans realized on 2019. This map drawn by Corey M. Fortezzo (USGS), Paul D. Spudis (LPI), and Shannon L. Harrel (SD Mines) for the U.S. Geologic Survey / Astrogeology Science Center in Flagstaff makes différence of the terrans types by colors. It's the most precise geological of the Moon today. The original map can be downloaded at :
https://astrogeology.usgs.gov/search/map/Moon/Geology/Unified_Geologic_Map_of_the_Moon
We have applied it on the "LOLA / Kaguya Shaded" texture to associate it to the relief.

The caption is the following :

- "LAC / LPI / O'Brien"
Texture realized when assembling of the « Lunar Aeronautical Charts" realized
by the United States Air Force (USAF) and published by the Lunar and Planetary
Institute (LPI). This texture has been built by David O'Brien of the Planetary
Science Institute (PSI) who prosed kindly to the VMA authors to use it in the
Atlun module. LPI has also given the authorization to use these reproduction of
their maps.
The best drawn maps of the Moon ever published are the
"Lunar Astronautical Charts" (LAC) and the "Lunar Maps"
(LM). Their scale is 1/1 000 000 th. Most of them include altitude levels
curves giving instantly an estimation of the height or depth of the formations.
They have been built to survey the lunar areas
according to the future Apollo missions. You will notice that they don’t use an
uniform colors set. Sure, they only show the Moon Visible Face since they are
based on observations and pictures taken from the Earth.

This remarkable
maps collection can be seen on the site :
We thank a lot David O'Brien and the LPI for
permitting us to use their work in VMA.
The box "Historical" gives access to a scrolling list of the historical textures used by VMA Pro 6.
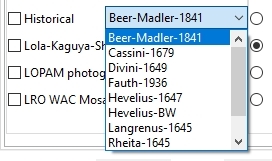
The following screen
captures show you old maps extracts adapted to VMA. Four textures are
available today and several others will be processed soon.
Important note:
These textures realized from old maps without any coordinates system
induce sometimes large shift between some formations and their labels.
More, as they are Nearside maps, when apllied on the whole Moon globe,
the Farside is not drawn.
"Langrenus 1645" Texture from a map established by Michael Florentius Langrenus on 1645 and called : "Plenilunii - Lumina Austriaca Philippica". Note the completely different names compared to the present IAU nomeclature but some of them.

"Rheita 1645"
Texture
realized from the map established by Anton Schylde de Rheita in 1645
and included in his "Oculus Enoch and Eliae sive Radius Sidereo
Mysticus".

"Hevelius 1647"
: Texture
drawn on the basis of the map of Johannis Hevelii (or Ioanne
Hevelio) and published on 1647 in his book "Lunae Descriptio".
The orifinal map owns two extensions for the NE and SW librations not
available in the texture. There is also a B&W version and some
versions withouit any names. B&W versions can be engraved or gray
scaled printed

"Divini 1649"
Texture
realized from the map established by Eustachio Divini in 1649. It is an
extrapolation of the map of Hévélius and not an own creation.

"Riccioli 1651"
Texture
realized from the map established by Francesco Grimaldi in 1651 which
incorporated the nomenclature of Giovanni Riccioli, nomenclature which
is still widely used today.

"Cassini 1679" : Texture drawn on
the basis of the map of Giovanni Domenico Cassini (Jean-baptiste Cassini I) on the basis of observations with measures to the eyepiec and presented to the French Academy of Sciences on 1679. It was the most precise lunar map in its era. It was 52 cm in diameter and have been engraved on the basis of drawings by Sébastien Leclerc and Jean Patigny.


"Beer & Madler 1845"
Texture
established from the map drawn up by Wilhelm Beer & Johann Heinrich
Mädler in 1841 and published under the name of "Mappa Selenographica".

"Fauth 1936"
Texture established from the map established by Fauth in 1936 and published under the name of "Unser Mond".

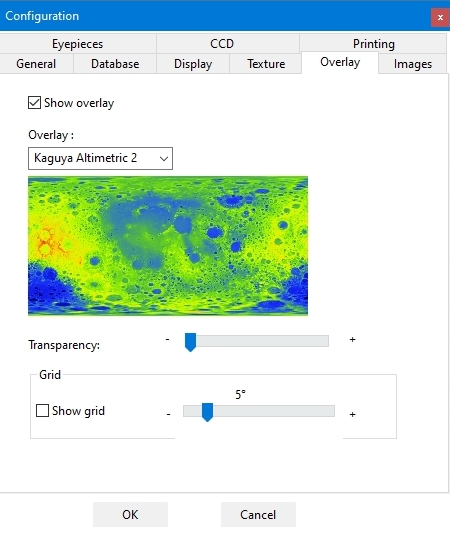
"Overlays" tab
The texture "LRO - Kaguya - Shaded is recommended for the application of scientific layers. You can also choose not to display a texture in the" Textures "tab of the" Configuration "menu.
We are continually looking for new data posted online that can be incorporated into the AVL.
"Show overlay" Box
If you fill the "Show overlay" box, you display the overlay choosen with the scrolling list below over the choosen texture.
"Overlays" Scrolling list
If you activate the scrolling list, you can choose in the list the overlay
that you need. Here are the list of the overlays presently involved in
VMA. We will add on our site new overlays to download as soon as they
will be available. You'll find :
- Colors and albedo overlays
- Geological overlay
- Topographical overlays
- Elements concentration overlays
- Neutrons emissions overlays
- Gravity measurement overlays
Colors and albedos overlays presentation
"Albedo" overlay

This overlay shows the Moon surface albedo. It's extracted
from Clementine datas. This overlay id very useful with the "Aerograph
without albedo"
texture because this one doesn't present the albedo display. There
is no caption since it's only an overlay.
"Natural colors" overlay

This overlay tries to show the Moon globe natural color. It's extracted
from a color mosaic realized with Clementine filtered pictures with an
equilibrium between the 3 RGB channels.. There
is no caption since it's only a color.
"Enhanced colors" overlay

This overlay has been obtained while pushing to maximum color contrast enhancement in the three primal spectral colors. There is no caption since it's only a color. It shows subtile colors variations between highlands and mare surface and also shows different lavas flows in these marias.
"Clementine color ratio" overlay

This overlay has been obtained from the Clementine maps of the "PDS Map A Planet"
site. Colors variations indicate lunar surface composition variations.
The Clementine Ratio ("false color") views of the Moon are created by
generating ratio images using 3 of the 5 Clementine UV/Vis camera bands
and combining these into the red, green, and blue channels of a color
image:
Channel Ratio (band/band)
Red 750 nm/415 nm
Green 750 nm/950 nm
Blue 414 nm/750 nm
The color ratio image product serves to cancel out the dominant brightness
variations of the scene (controlled by albedo variations and topographic
shading) and enhances color differences related to soil mineralogy and
maturity. The lunar highlands, mostly old (~4.5 billion years) gabbroic
anorthosite rocks, are depicted in shades of red (old) and blue (younger).
The lunar maria (~3.9 to ~1 billion years), mostly iron-rich basaltic
materials of variable titanium contents, are portrayed in shades of yellow/orange
(iron-rich, low titanium) and blue (iron-rich, higher titanium).
Superimposed on and intermingled with these basic units are materials from
basins and craters of various ages, ranging from the dark reds and blues
of ancient basins to the bright blue crater rays of younger craters. (Reference:
Pieters, C.M., M.I. Staid, E.M. Fischer, S. Tompkins, and G. He, 1994, A
sharper view of impact craters from Clementine data, Science, 266,
1844-1848)
"Physical characteristics" overlays presentation
"Daytime surface temperature Chang’é 2 " overlay


This overlay has been realized with Chang'é 2 datas. It shows lunar surface temperature with the sun at the higher point in the sky. It doesn't shows real time surface temperature. The caption shows that temperatures range is between 240 °K (-33 °C) at poles to 400 °K (127 °C) at the equator.
"Night time surface temperature Chang’é 2 " overlay

This overlay has been realized with Chang'é 2 datas. It shows lunar surface temperature on the obscure part of lunar globe. It doesn't shows real time surface temperature. The caption shows that temperatures range is between 240 °K (-33 °C) at poles to 400 °K (127 °C) at the equator.
"Clementine Altitude" overlay


The captions are in feet. The left column is based on a linear scale for color spectra, while the right one is based on a linear scale for altitudes.
This overlay is conceived with altimetric datas recorded by Clementine probe and compiled by Maria T. Zuber and her LPI team. The overlay allows you to locate relative altitudes. It has been used to confirm the existence of the "South Pole / Atkein" impact basin in the Southern part of the Farside.
Altitude "ULCN 2005" overlay

This overlay is realized with a combination of altimetric datas recorded by Apollo missions, Clementine and Lunar Prospector probes and Earth based datas, specially with radiotelescopes in radar mode. They are online at the USGS site maintained by Brent Archinal and his team . It gives relatives altitudes of formations.
It's recommanded to use this overlay with the texture « Aerograph without albedo ». There is no caption found for this overlay. So it's only indicative informations.
"Kaguya Altitude" overlay


This overlay is a second one realized with altimetric datas recorded by the japanese probe Kaguya and put online by JAXA team. It gives relatives altitudes of formations. It's presently the most precise altimetric lunar planisphere.
« Geological and gravity » overlay presentations
"Geological" overlay

This overlay has been realized with datas available on the USGS "Astrogeology / Webgis" and gathers several different Moon geological maps. Because each of the composing map has its own caption, the global caption, difficult to conceive, is not available presently.
"USGS Geological 2020" layer

This
overlay has been realized with datas available on the USGS
"Astrogeology / Webgis" and gathers several different Moon geological
maps in 2020. It's like the equivalent texture and have the same
caption. We recommand to use it with no texture
"Rocks types" overlay

This overlay is realized with Clementine probe orbital datas
compiled by Dr Maria T. Zuber and her USGS team. It shows
differences between surface rocks compositions. There is no caption
found for this overlay.
"Water / Chandrayann" overlay


This layer is made from orbital data recorded by the Indian Chandrayann 1 probe and compiled by ISRO and Shuai Li and Ralph E. Milliken in 2017. It allows to visualize the presence of water in the surface rocks.
"Silicates LRO" overlay

This overlay has been realized with datas from
"Surface roughness LRO" overlay

This overlay has been realized with datas from
"Slope & surface roughness LRO" overlay

This overlay has been realized with datas from
"Soil atomic mass" overlay


This overlay is realized with Lunar Prospector probe datas compiled by Dr Alan Binder and his team. It shows soil atomic mass. It's visible that Nearside seas have higher atomic mass showing heavy elements presence. The caption is in grams / mole.
"Crust thickness" overlay


This overlay is conceived with orbital variations datas recorded by Clementine probe and compiled by Maria T. Zuber and her LPI team. The overlay allows you to visualize the lunar crust thickness under the formations. It will confirm you that this one is the lowest under the marias and the thickest on the Moon Farside.
"Bouger Gravity" overlay


This overlay is conceived with gravimetric datas recorded by Clementine probe and compiled by Maria T. Zuber and her LPI team. They have been completed with Dr Alan Binder and his team results from Lunar Prospector probe.overlay allows you to visualize gravitic anomalies under the formations. The unit is milligals. The biggest anomalies are under the marias showing the famous "mascons" presence. These datas are corrected with the Bouger method taking account of the soil density in the measurement site.
"Free Air Gravity" overlay


This overlay is conceived with gravimetric datas recorded by Clementine probe and compiled by Maria T. Zuber and her LPI team. They have been completed with Dr Alan Binder and his team results from Lunar Prospector probe.overlay allows you to visualize gravitic anomalies under the formations. The unit is milligals. The biggest anomalies are under the marias showing the famous "mascons" presence. These datas are corrected with the "Free air" method taking account of the altitude above the measurement site.
"Geoid anomalies" overlay


This overlay is conceived with graviimetric datas recorded by Clementine probe and compiled by Maria T. Zuber and her LPI team. They have been completed with Dr Alan Binder and his team results from Lunar Prospector probe.overlay allows you to visualize Moon globe shape anomalies which is not perfectly spherical. It whows that the Farside is less round than the Nearside.
"Free Air Gravity / GRAIL degree 2 to 700" overlay ("Free Air gravimetry with harmonic degrees less than 700")

This overlay is produced from gravimetric data recorded by the two GRAIL Ebb & Flow probes and compiled by Dr Maria T. Zuber and his team from the USGS. It is expressed in milligals. It allows you to view gravity anomalies in the area of formations. We thus realize that strong anomalies correspond to the seas and betray the presence of the famous "mascons". These data are corrected according to the "Free air" method which takes into account the altitude of the formations at the measurement right. We have not found a legend for this overlay.
"Free Air Gravity / GRAIL degree 7 to 700" overlay ("Free Air gravimetry with harmonic degrees between 7 & 700")

This overlay is produced from gravimetric data recorded by the two GRAIL Ebb & Flow probes and compiled by Dr Maria T. Zuber and his team from the USGS. It is expressed in milligals. It allows you to view gravity anomalies in the area of formations. We thus realize that strong anomalies correspond to the seas and betray the presence of the famous "mascons". These data are corrected according to the "Free air" method which takes into account the altitude of the formations at the measurement right. We have not found a legend for this layer.
"Bouguer Gravity / GRAIL" overlay ("Bouguer" Gravimetry)

This
overlay is produced from gravimetric data recorded by the two GRAIL Ebb
& Flow probes and compiled by Dr Maria T. Zuber and his team from
the USGS. It allows you to view gravity anomalies in the area of formations. It is expressed in milligals. We thus realize that the strong anomalies correspond to the seas and betray the presence of the famous "mascons". These
data are corrected according to the Bouguer method which takes into
account the density of the soil at the right of the measurement. We have not found a legend for this overlay.
"Crustal thickness / GRAIL degree 1 to 700" overlay

This overlay is produced from gravimetric data recorded by the two GRAIL Ebb & Flow probes and compiled by Dr Maria T. Zuber and his team from the USGS. It is expressed in km. It makes it possible to visualize the variations in the thickness of the crust at the level of the formations. We thus realize the strong under-thicknesses corresponding to the seas which betray the presence of the famous "mascons".
« Elements presence » overlays presentation
"Hydrogen" overlay

This overlay is conceived with Dr Alan Binder and his team results from Lunar Prospector probe. This overlay allows you to visualize hydrogen repartition on the surface. There is no caption available presently, but red is for high hydrogen concentrations and blue for the lowest.
"Chandrayann 1 / Water" overlay
This overlay is conceived with ISRO results from Chandrayann 1 probe. This overlay allows you to visualize waterrepartition on the surface.
"Iron" overlay


This overlay is conceived with Dr Alan Binder and his team results from Lunar Prospector probe. This overlay allows you to visualize iron repartition on the surface. Immediatly, you can see that Nearside marias are rich with iron.
"Iron oxyde / FeO" overlay

This overlay is conceived from Clementine probe datas. FeO (Iron oxydes) values can be useful in identifying basalt-excavating craters, and so possible cryptomares (Basalt seas covered by more recent materials).
"Titane" overlay

This overlay is conceived with Dr Alan Binder and his team results from Lunar Prospector probe. This overlay allows you to visualize titane repartition on the surface. Immediatly, you can see that Nearside marias are rich with this metal.
"Potassium" overlay


This overlay is conceived with Dr Alan Binder and his team results from Lunar Prospector probe. This overlay allows you to visualize potassium repartition on the surface. The measurement unit is based on detection counts. Immediatly, you can see that Nearside marias are rich with this element.
"Gadolinium" overlay

This overlay is conceived with Dr Alan Binder and his team results from Lunar Prospector probe. This overlay allows you to visualize gadolinium repartition on the surface. Immediatly, you can see that Nearside marias are rich with this element.
« Radioactive elements repartition" overlays
"Thorium" overlay

This overlay is conceived with Dr Alan Binder and his team results from Lunar Prospector probe. This overlay allows you to visualize potassium repartition on the surface. No caption is available presently, but red is for high hydrogen concentrations and blue for the lowest.Immediatly, you can see that Nearside marias are also rich with this element.
"Uranium" overlay


This overlay is realized with japanese probe datas compiled by JAXA team. The caption is based on uramium emitted particles count. It can vizualize roughly uranium in formations. It's easily seen that Nearside seas are rich with this element.
"Radon" overlay

![]()
This overlay is conceived with Dr Alan Binder and his team results from Lunar Prospector probe. This overlay allows you to visualize radon repartition on the surface. The caption is based on radon emitted particles count. It can vizualize roughly radon in formations.
"Polonium" overlay

![]()
This overlay is conceived with Dr Alan Binder and his team results from Lunar Prospector probe. This overlay allows you to visualize polonium repartition on the surface. The caption is based on polonium emitted particles count. It can vizualize roughly radon in formations.
« Neutrons emissions» overlay presentation
"Neutrons epithermal" overlay


This overlay is conceived with Dr Alan Binder and his team results from Lunar Prospector probe. This overlay allows you to visualize number of detected "epithermal" neutrons on the surface. The measurement unit is based on detection counts. Immediatly, you can see that Nearside marias are powerful emiters.
"Neutrons broadband" overlay

This overlay is conceived with Dr Alan Binder and his team results from Lunar Prospector probe. This overlay allows you to visualize number of detected "broadband" neutrons on the surface. The measurement unit is based on detection counts. Immediatly, you can see that Nearside marias are powerful emiters.
"Neutrons fast" overlay


This overlay is conceived with Dr Alan Binder and his team results from Lunar Prospector probe. This overlay allows you to visualize number of detected "fast" neutrons on the surface. The measurement unit is based on detection counts. Immediatly, you can see that Nearside marias are also powerful neutrons emiters.
« Radiations emissions" overlays presentation
"Gamma rays" overlay


This overlay is realized with japanese probe Kaguya datas compiled by JAXA team. The caption is based on gamma rays level detected by the probe. It can vizualize roughly gamma rays levels in formations. It's easily seen that this repartition is rather uniform.
"Transparency" cursor
This cursor allows you to choose the transparency degree of the overlay applied above the texture. It doesn't operate on the texture. When the cursor is on the right, the overlay very visible. On left, the underlaying texture is almost invisible. Choose what degree you would apply to be able to see all the details together. (Example shown without underlaying texture).
![]() < Non
transparent overlay
< Non
transparent overlay ![]() Transparent overlay
Transparent overlay
"Grid " frame

The radio button « Show grid » displays or not a white grid with meridians and parallels on the lunar globe surface.
The cursor changes grid density. This one varies from 1° until 30 °.

1° Grid

5° Grid

30° Grid
"Pictures" tab
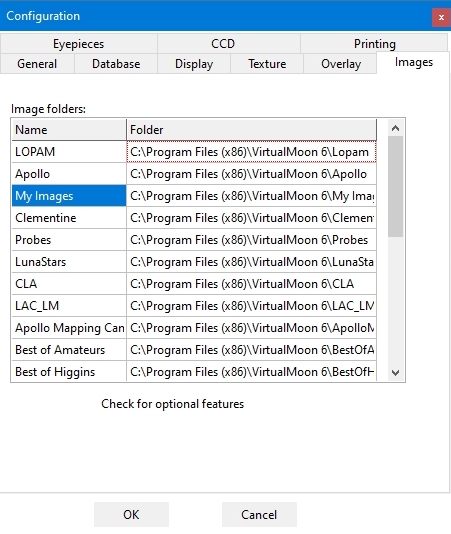
This tab is used to sort the available pictures in the library
because their number will increase constantly, and the pictures display
setup.
Pictures directories list
You can edit the list of the "picture directories". In addition to the "LOPAM", "Clementine", "Probes", "Apollo", "Apollomapping", "CLA" and "My images"downloadable pictures, you can create one or more new directories to put in your own webcam or CCD pictures, or pictures coming from other sources and legally acquired, such as the "Best of amateurs series" present on VMA Web site..
"Eyepieces" tab
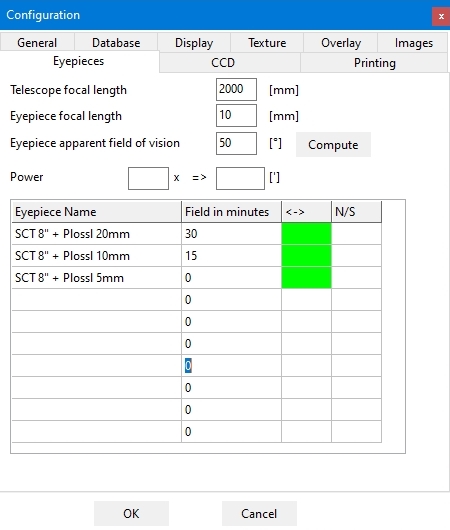
This tab is used to setup parameters of your own eyepieces so thet,
you could display the real Moon aspect when observed in your instrument
with "Eyepiece" context menu function ("LUN"
is for "LUNETTE" = "REFRACTOR" in french).
Eyepieces list
You can enter directly your eyepieces parameters in list fields if you
know them, as shown by the exemple which can be erased. "Name
of the eyepiece" is in the left column and the "apparent
field" in arc minutes in the right column. You can enter up to
10 eyepieces. It's better to enter them in the increasing magnification
way.
Eyepieces parameters computation
Eyepieces parameters can be computed with the help of our calculator. First enter the "Instrument focal length". Then enter the "Eyepiece focal length". Then enter the "Apparent eyepiece field of view" in the third field. This field is that indicated in eyepieces advertisements. For example, Plossl eyepieces apparent field is about 50° and Ultra Wide Angle eyepiece is 82°.
Push the "Compute" button. In the "Real eyepiece field " frame, the area diameter is displayed in arc minutes. In the "Eyepiece magnification" frame, the magnification of the choosen eyepiece is indicated. After that, you have just to copy these two values in the two colums of the lower table.
You can also input directly the orientation view effects according to
your instrument type by clicking in the boxes of the "<->"
(Right - left inversion) and "N/S" (North / South inversion).
If the rectangle is green, so the effect is activated. If it's red, so
the effect is not activated. For example : if you use a Schmidt-Cassegrain
or a refractor, the "<->" rectangle of the eyepiece must
be green, but the "N/S" must be red. For a Newtonian telescope,
the "<->" rectangle must be green and the "N/S"
must be green too.
"CCD" tab
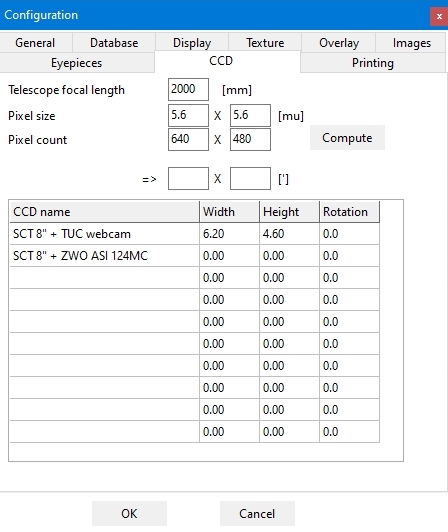
This tab allows
you to enter parameters of your CCDs cameras or others pictures makers
to view their real field on the lunar map according to your instrument
specifications.
Cameras list
You can enter directly your cameras specifications in the list fields if you know them :
Description
in the left column "CCD Name" and field dimensions in pixels. An
exemple is shown by default. You can enter 10 products at maximum. It's
better to enter them with their incresing magnification.
Computing cameras parameters
If you don't know your cameras parameters, a small calculator can help you. Just enter the instrument focal length and capteur dimensions in pixels.
push the "compute" button. In the real field cases you will see the dimensions of the lunar area that will be imaged.
"Printing" tab
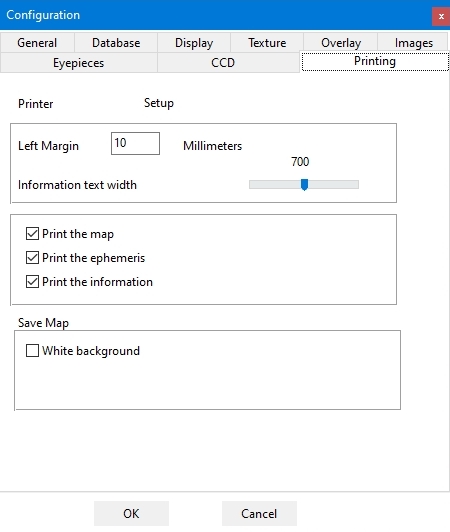
This tab is used to setup map printing parameters.
"Setup" button
This button shows the standard Windows printing setup window.
Printing format
This area is used to choose printing margins width and change the
Description text width.
Printed documents
These boxes are used to select the documents that will be printed.
The printed map is that of the last window map. Topographic maps are black and white and geologic map are colored with color names in both types. Maybe you will have to change the Description text width to better see printed names.
"Ephemeris" text contains orbital, phase and libration information according to the last date and hour selected in the "Ephemeris" window.
"Description" text contains the information page of the last chosen formation on the map.
"Save map" frame
Displayed map can be printed on paper with white background around the lunar disk to speed up printing and save ink!
"Help" MENU

This menu brings up help tools to aid using the atlas.
"Help" choice
This choice displays the present manual in an independent window.
"Glossary" choice

This choice gives access to a glossary containing more than 100 words and expressions linked to the Moon and its observation.
The glossary is also in an independent window which is divided in three distinct parts :
Upper part contains alphabet letters. Clicking on one of them gives access to the words beginning with this selected letter.
Left lower part is a tree of letters and associated words.
Right lower part contains an explanation of the selected word or expression.
"Encyclopedia" choice
This choice shows you a page with main dimensions of Moon globe and orbit.
"About" choice
This choice shows the version of the program, and indicates how Christian Legrand and Patrick Chevalley divide their work in the creation and development of this atlas.

ZOOM CURSOR

Sliding this cursor from left to right increase zoom magnifying power of the map (See "Map window").
If cursor is on left, lunar globe is entirely visible. Moving it to the
right increases zoom power (zooms in).
Depending on the resolution textures chosen in the settings (See "Settings tab"), zoom will not show new details and map display can become fuzzy.
Display of labels and marks is a function of zoom factor and of labels
density (See "labels
and marks").
"1:1" BUTTON

Clicking on this button returns the map to the whole lunar
globe display in the "Map window".
"Center" BUTTON

Clicking on this button will make the lunar globe center displayed on the center of your screen when zoom is 1/1. It also centers the formation you have selected.
"North / South " BUTTON

If you click on this button, you immediatly invert the North - South in the "Map" window. It must be used with the "East - West" button below to change from naked eye view to Newtonian view.
"East / West " BUTTON

If you click on this button, you immediatly invert the East - West in the "Map" window. It must be used to change from naked eye view to refractor or catadioptric telescope view.
"Full globe / Rotation" button

When clicking on this button, you access to the most powerful function of ATLUN (c). If the button is Up, the map window shows you the Near Side visible from the Earth with phase and libration applied if you checked the boxes in the "Display" tab of the "Configuration" menu.
But if you click down on this button, you go to "Full globe" mode and the map window displays a complete globe in three dimensions that you will be able to observe on all its faces.
"Libration" BUTTON

If you click on this button, you display or remove the libration effect on the Moon globe of the "Map" window.
"Grid" BUTTON

When clicking on this button, the grid choosen in the "Overlays" tab of the "Configuration" menu is displayed on the luner globe. The space between parallels and meridians is that has been choosen in the tab, from 1 to 30 °.
"Phase" BUTTON

If you click on this button, you display or remove the phase display on the Moon globe of the "Map" window.
If the "Dynamic shadows" option has been selected in the "Textures" tab of the "Configuration" menu, it's displayed.
"Scale" BUTTON

When clicking on this button, a scale in angular dimension is displayed at the left botton of the map window.

Beware ! This scale indicates the "visual" angular size. It doesn't indicate the dimensions on the lunar globe. For measuring distances on the globe, you must use the "distance measure" tool comprised in the "Tools" tab.
"Labels" BUTTON

This button allows you to access the color choice window for map labels. Its use helps a lot to adapt quickly the labels colours to the map hues context, specially with scientific overlays use.
THE LABEL CURSOR

By adjusting this slider, you can adjust the number of labels displayed at the same time on the selected "Map" window.
Completely to the left, the lunar globe is entirely devoid of labels. By moving the cursor to the right, we increase the number of visible labels. This number also varies depending on the zoom level.
Depending on the number of databases used, the display can be very crowded, even at maximum zoom.
"Neighbor" BUTTON

When clicking on this button, a new picture that contains the names of the formations in the neighborhood of the selected formation. You can click on one of them to go directly there.

"Picture" BUTTON

The "Picture" button gives now access to PHOTLUN (c), the VMA Pro pictures manager.
The "PhotLun" (c) window
The miniatures band appears with the menu bar.

This module allows a more easier choice for displaying pictures because of the pre-visualization miniatures pictures.You get the original image of the tab you clicked on in a separate window.

We send you back to the specific PHOTLUN (c) documentation to discover all its possibilities and specially the pictures treatment functions (Rotation, zoom, contrast and luminosity).
The pictures library
The pictures library is modular, so you can add a number of sources. You can download for this version picture files coming from various sources. These files have obtained the necessary authorizations to be used only in VMA.
"LUNAR ORBITER PHOTOGRAPHIC ATLAS OF THE MOON" PICTURES


"Aristillus" and "Vallis Alpes"
These pictures have been extracted from the electronic version
of the "Lunar Orbiter Photographic Atlas of the Moon" (LOPAM) realized
by Jeff Gillis and his team at the Lunar and Planetary Institute.
This remarkable atlas can be consulted on the site
http://www.lpi.usra.edu/resources/lunar_orbiter/
Christian Legrand has extracted from each of the more than 200 LOPAM
photos, pictures of each named formation. He compiled about 3000 pictures.
Then, he chose the best one for each formation.
For some formations, which were spread on several photos, it was
necessary to cut and join several peaces. Some others need a new orientation.
All these pictures were then compressed so that small size for downloading
that doesn't alter quality.
Please note that these pictures have been "lines removed" using the powerful software provided by Niels Noordhoek
Despite of this important work, about 150 formations haven't been recovered in the LOPAM photos because Lunar Orbiter 4 didn't photography the entire visible face with sufficient resolution.
For those who don't wish to download all the pictures, Christian Legrand has selected the more famous lunar formations (130) and has gathered them in the "Lunar stars" library.
These pictures are under "Lunar and Planetary Institute" copyright and cannot be used outside VMA.
LOPAM pictures are in the "LOPAM" sub-directory.
APOLLO MISSIONS PICTURES

With the goal to provide the most complete image of each lunar formation, Christian Legrand has also selected in the Apollo missions pictures more than 400 pictures related to more than 300 different formations. These pictures are very often from the hand-held Hasselblad pictures.
These pictures are provided under the general copyright of the "National Air and Space Administration" (NASA) which own reproduction rights ( http://www.nasa.gov ) and they can't be used outside of the atlas.
Picture name indicates the formation name and the Apollo mission that took the picture when it's known : so COPERNICUS_A12.JPG is the name of a picture of Copernicus taken during Apollo 12 mission.
APOLLO pictures are in the "Apollo" sub-directory.
APOLLO MAPPING CAMERAS MISSIONS

Theophilus seen by Apollo 16 Mapping Camera.
Put online by the "Lunar and Planetary Institute", "Apollo Mapping Cameras" pictures, who were on board "Apollo Service Modules", are among the most detailed ever realized. Christian Legrand has selected among hundreds of published frames, those which give the most interesting views of Nearside formations as those above.
Christian Legrand has extracted about 1000 pictures and has choosen about 700 ones.
These pictures are provided under the general copyright of the "Lunar and Planetary Institute" and they can't be used outside of the atlas.
Picture name indicates the formation name and the Apollo mission that took the picture when it's known : so COPERNICUS_A12.JPG is the name of a picture of Copernicus taken during Apollo 12 mission.
APOLLO MAPPING pictures are in the "Apollomapping" sub-directory.
LUNAR PROBES PICTURES


Soviet Luna 17 pictured by mobile robot Lunakhod 1 (Left) and Tycho crater walls panorama taken by american probe Surveyor 7 (Right).
Many other automatic probes than Lunar Orbiter 4 have measured and photographed the Moon. These are american Ranger, Lunar Orbiter 1,2,3,5 and Surveyor. In the historical "Moon race" context, ex USSR has also launched a great number of Luna probes.
This picture library realized by Christian Legrand contains about 120 pictures taken by these probes. Found on the Web, these pictures are provided under the general copyright of the "National Air and Space Administration" (NASA) which own reproduction rights ( http://www.nasa.gov ) and they can't be used outside of the atlas. Soviet probes pictures have no identified copyright owners.
Picture name indicates the formation name and the probe or Apollo mission
that took the picture when it's known : The following code is used associated
with XX as the mission number :
- AXX : Apollo
- LOXX : Lunar Orbiter
- LUXX : Luna
- RAXX : Ranger
- SUXX : Surveyor
For example, LUNA 9_LU9.jpg is a picture of Luna 9 site taken by Luna 9 probe itself.
These pictures are provided under the general copyright of the "National Air and Space Administration" (NASA) which own reproduction rights ( http://www.nasa.gov ) and they can't be used outside of the atlas.
Probes pictures are in the "Probes" sub-directory.
CLEMENTINE PROBE PICTURES


Arzachel crater picture taken by Clementine (Left) compared to that of LOPAM (Right).
The other great source of lunar formations pictures is the american Clementine mission. This small probe has mapped the lunar surface with à 100 to 200 m per pixel.
Christian Legrand works on the general files and extracts pictures of each formation.
Clementine pictures are complementary to those of LOPAM. If their resolution and general quality are better, they have a big defect for terrestriel observers. They were taken with Meridian passing Sun, with the most vertical possible lighting that erases shadows and gives the formation albedo.
For formations situated in a + 45 ° North and - 45 ° South, Pictures show first the albedo. Compare for example with Bessarion LOPAM and Clementine pictures to see the difference.
For formations above these latitudes, shadows reappeared and many pictures are better than LOPAM. Compare with Anaxagoras for example.
Connect periodically to our site to discover the new additions.
These pictures are provided under the general copyright of the "National Air and Space Administration" (NASA) which own reproduction rights ( http://www.nasa.gov ) and they can't be used outside of the atlas.
Clementine pictures are in the "Clementine" sub-directory.
JAPANESE PROBE KAGUYA PICTURE

Rupes Recta photographied by Kaguya (c) JAXA
These pictures have been obtained from datas returned by the japanese probe KAGYA et put online on the Japan_Aerospace_eXploration_Agency (JAXA) Web site. You can see the original pictures here :
http://wms.selene.jaxa.jp/index_e.html
Christian Legrand has extracted from each original picture, a picture of each present formation. 160 useful pictures have been collected today. The pictures are taken with an angle from the surface. This feature brings new informations about the real shape of the formations. (see Rupes Recta above)
These pictures are provided under the general copyright of "Japan_Aerospace_eXploration_Agency" which owns the copyright. The pictures can't be used outside of the present software.
EUROPEAN SMART-1 PROBE PICTURE

Pascal crater photographied by Smart-1 (c) ESA
These pictures have been obtained from datas returned by the european probe Smart-1 and put online on the European Space Agency (ESA) archives Web site. You can see the original pictures here :
https://archives.esac.esa.int/psa/#!Table%20View
Christian Legrand has extracted from original picture, a picture of each present formation. 102 useful pictures have been collected today, mainly from near poles craters. The pictures are often taken with a vertical angle from the surface. This feature brings new informations about the real shape of these formations rarely pictured. (see Pascal above)
These pictures are provided under the general copyright of "European_Space_Agency" which owns the copyright. The pictures can't be used outside of the present software.
CONSOLIDATED LUNAR ATLAS PICTURES
The best ever published lunar atlas for the lunar observer is the "Consolidated Lunar Atlas " by Gerard Kuiper and al.
It copiles best Moon pictures taken from Earth by some great observatories as Catalina and Pic du Midi. Resolution of some pictures are about 1 km. Only since little time, amateurs equiped with webcams and large telescope begin to have better results than those ones.
This atlas has an unvaluable value because, as "Georges Viscardy's Photographic Atlas", it shows the formations under sevearl sun lightings and at the Full Moon.
For eample, here are the pictures extracted for Archimedes :


These pictures allows you to see the aspects of a given formation related to the observing day. This library is presently not complete. It contains more than 2000 pictures and will be updated regularly. Priority is given to CLA pictures above Clementine pictures because they are more useful for terestrial observers. And our "Clementine 500 m resolution" texture replaces them momentarily. Check regularly our Web site to see if CLA library updates are available.
These pictures are under "Lunar and Planetary Institute" copyright and cannot be used outside VMA.
This fabulous work is visible on the site :
The CLA pictures are in the "CLA" sub-file.
LUNAR ASTRONAUTICAL CHARTS AND LUNAR MAPS PICTURES
The best drawn Moon maps ever published are the "Lunar Astronautical Charts" and the "Lunar Maps". Their scale is 1 / 1 000 000. Most of them include altimetric levels curves allowing to determine heights or depths of formations.


Christian Legrand has extracted from LAC / LM more than 800 formations pictures of the Nearside. Because of their precision and their colors, these pictures have not been compresses. This library is then heavy to download.
These pictures are under "Lunar and Planetary Institute" copyright and cannot be used outside VMA.
This fabulous work is visible on the site :
The Lunar Astronautical Charts and the Lunar Maps pictures are in the "LAC / LM" sub-file.
All this unique set of pictures librairies provides you numerous views of formations for comparing or studying them.
"BEST OF AMATEURS" LIBRARIES
Some of the world best lunar imagers have accepted to show their pictures in a special VMA pictures library only usable with VMA.. Compiled by Christian Legrand, this new library contains presently more than 350 images from Craig Zerbe, Mike Wirths, Wes Higgins, Zac Pujic and Paolo Lazzarotti. Others amateurs have been contacted and their pictures will be added in this library whose pictures are very often better than those of Consolidated Lunar Atlas, and which rival sometimes with lunar automatic probes.
Because of the great numbers of pictures they provided, pictures by
Paolo Lazzarotti and Wes Higgins ar in separate libraries.
Christian Legrand has treated, with the authorization of the authors some of the pictures for harmonicizing contraste and luminosity to boost the resolution.
- T1MPDM /

-
Best of Peach: It contains pictures taken by Damian Peach with his Celestron 14 et un Celestron 9,25 (Bailly below). It's one of the most important amateur pictures library.

Best of Lazzarotti : Contains pictures realized by Paolo Lazzarotti with his 12" Gladius (Aristoteles here)

- Best of Higgins : Contains pictures realized by Wes Higgins with his 18" Dobson (Schiller here)

- Best of Amateurs : Contais picture relized by Mike Wirths (Hortensius domes here) and Craig Zerbe

Best of Cathala: It contains the images taken by Luc Cathala with a motorized Dobson telescope of personal manufacture of 625 mm in diameter with a QHYSIII178M camera. It is the most supplied "amateur astronomer" library with nearly 700 very high resolution images.

Pictures name indicate the formation name and that of the author. For example, Plato_Lazzarotti.jpg is a picture of Plato crater taken by Paolo Lazzarotti.
These pictures are under the general copyright of Christian Legrand and each copyright of the author and cannot be used outside of VMA.
All these libraries give now more than 7 000 formations pictures available to VMA users.
"DATLUN " Button

If you click on this button, you can open the "DATLUN" (c) window, which is the VMA database manager :

You can discover all the potential of this new software conceived by Christian Legrand and written by Patrick Chevalley if you consult its user's manual.
LE BOUTON
"WEBLUN "

If you click on this button, you open the "WEBLUN" (c) window containing the lunar Web sites database manager.

You can discover all the potential of this new software conceived by Christian Legrand and written by Patrick Chevalley if you consult its user's manual.
"2nd Window" BUTTON

If you click on this button, the "Map" window separates in two windows with equal width. This new window has the same properties as the main window. You obtain the "map" window, the "configuration" menu, the tabs and the buttons bar. Tomake active one of the 2 windows and access to its setup, click in it. The active window is then surrounded by a red border
This new window opens with the same lunar area as the first. So, you can easily compare the two windows and you can apply in this second window textures and overlays different from those of the first window.
Screen capture showing VMA one window with "altitude" overlay and second window with "iron" overlay.
The "Mother" window which is affected by the cursor is surrounded by a red border. Just click on the other window so that it becomes active in turn and surrounded by red.
Beware ! This new function needs a powerful computer to be exploited with all its possibilities (If possible, processor frequency above 2 GHz, 512 Mb RAM and a graphic card supporting OpenGL with 64 Mb video RAM)
"Full Screen" BUTTON

If you click on this button, the tabs on the right, the title bar and the status bar all disappear, leaving only the map window or the double map window only on the screen.

Fabulous for large monitors, LCD and plasma TV, and videoprojector !!!
It's also a very useful tool for lectures and planetariums about the Moon !
A click on the left button selects a formation.
Pressing the left button and moving the mouse moves the map. The mouse wheel drives the zoom.
You have still access to the right click menu for managing the views.
To find menus & tabs, simply press the "Esc" key or go to the context menu of the "Right click" and click on "Back window".
"EYEPIECE" BUTTON

By
clicking on this button, you can directly open the "Eyepieces" tab of
the "Configuration" menu with direct access to the list of eyepieces
that you have entered.
"CCD" BUTTON

By
clicking on this button, you can directly open the "CCD" tab of the
"Configuration" menu with direct access to the list of cameras that you
have entered.
"NOTES" BUTTON

By clicking on this button, you can directly open the "Notes" tab) on the right with direct access to the note taking tool.
"EPHEMERISIS" BUTTON

By clicking on this button, you can directly open the "Ephemeris" tab
with direct access to the date & time scanning tool.
"TABS" BUTTON

By clicking on this button, you can temporarily "detach" the tabs on the right to enlarge the "Map" window (s) (in two-window mode). You can then position them where you want as in the screenshot below. The "Tabs" window has the "Windows" buttons to put it in full screen (Global view of the "Information" data, for example "or delete it. The arrow of the" Tabs "button will change direction and by clicking a second time on it , you can redisplay the tabs.

"2ND MONITOR" BUTTON
If
you have two monitors connected to your computer as in the photo below,
by clicking on this button, you can temporarily display the tabs on the
right on this second monitor to maximize the window or windows on your
main screen " Map "(In two-window mode) without losing the tab information. Your mouse should be able to move around on both monitors.
The
arrow of the button will change direction and by clicking a second time
on it, you will be able to redisplay the tabs on the first monitor.


"Map" window is on the left of general window. At opening, it shows It shows Nearside according to the options selected (See "Map display "). This window can't be removed and is now independently sizable. Go with the pointer one the separation line with the right tabs. A new pointer appears. Stay with the mouse left button pushed and move it. The "Map" window width will be set.

Slide
bars appear according to the applied zoom factor (See "Zoom
cursor").
THE GLOBE MAP
It's oriented in the same direction as Moon seen with naked eye or binoculars.
You can turn the map around its center to copy the eyepiece vision in
a Newtonian. You can display the map as in a mirror to see it as in a
refractor or a Schmidt-Cassegrain instrument (See "Tools" tab).
"Near Side" map with inversion "<->"

If the "Libration" option (See "Configuration menu") is choosen, center of the map is not absolutely the center of the presented drawing because of libration. "Expert" version texture has been configured by Patrick Chevalley for an optimal display, specially for libration zones. The "aerograph" map in the window is provided by David Seals and his team from "Jet propulsion Laboratory" of NASA. it shows only the Near Side and corresponds to the details visible in a 120 mm (5") instrument applied on a 3D sphere with move limited to libration and managed by Open GL.
"Full globe" map

It permits to view a complete lunar globe and to study the Far Side invisible from the Earth (On the above screen capture, you can remark Mare Orientale). It's always the same "David Seals" texture presenting details visible in a 120 mm (5") instrument applied on a 3D sphere, but in that case with no limited move.
If the options "Display libration" and " Display phase " (See "Configuration menu ") are checked, the lighting of the lunar globe is as the real one, for the date and hour choosen in the " Ephemerisis" tab.
Map move
As a zoom factor is applied to map, you will be able to move into it.
In the "Near Side" mode, you can also "grab" the map
in left clicking on it and keeping left button clicked while moving the
mouse.
In the "Full Moon" mode, you can also "grab" the globe with a mouse left click and while keeping left button click, you can turn the globe in the East or West direction when moving the mouse.
Mouse right click
A right click on the mouse and a context menu appear with several choices.

Information : Sends you to the information database window.
Notes : Send you to the "Notes" tab
Picture : Displays the pictures list or the LOPAM picture of the selected formation.
Neighbour : Displays in a new window the formations list in the neighbourhood of the selected formation.
Center : Centers the map on the selected formation.
Zoom : Can setup directly the zoom factor to 1/1, 1/2 or 1/4.
Eyepieces : Allows you to choose the used eyepiece and have the exact view in the associated instrument. A black mask with a round centered hole appears on the "Map" window. To cancel, just click the "None" option.
CCD : Allows you to
choose your electronic camera and to vizualize its field on the Moon. A
colored frame appear. If you want to remove it, just click on the
"none" option.
Distance : Activate the mode "Distance measurement" (Voir "Distance measurement")
Full screen : Allows you to remove the menus and tabs to assign the one or two "Map" windows (In two-window mode) to the entire screen area.
Orbit the Moon : Activated only in the "Full globe" mode. Activate an automatic rotation to "scroll" the globe as in the case of a simulated "satellisation". Indicated speeds are in "degree of longitude per second", or the manual rotation with "Direction".
Overlay caption :
Activated only when one overlay is displayed above the texture. Note
that some overlays don't have a caption as indicated above.
THE "INFORMATION" tab
SEARCH SCROLLING LIST
You can enter in this scrolling list some letters of the name of the
formation you want to find. It will accept "wildcards", so "*tri"
will include in the scrolling list "Triesnecker" and "Rimae Triesnecker",
for example.
.
"Outline" FRAME

In this frame, outline of the formation selected within your search and whose description is in the "Database window" is displayed (See "Outline" for more information on the display)
Here is a semi-graphic field presenting the formation profile. This information is only provided when height is known.
Profile has not be constructed for some formations types :
- Sea
- Lake
- Gulf
- Marsh
- Ocean
- Probe
- Human mission
The profile is generated according to the following description :
Crater outline :
Crater is presented so :
A________________A
< n characters>
"A" characters show the slope height. The number of "_" characters shows the crater width with the same scale as height.
Because the "A" character is twice high than wide on an html screen,
in the above example, the width / height crater ratio is 1/8.
The central mountain of crater has not been represented because their height has often not been found.
Don't forget that each formation has its own profile. You can't compare two craters dimensions using their profile representation.
A__________A Profile of (Length =20 km & height = 4000 m)
A__________A Profile of (Length = 5 km & height = 1000 m)
On screen, these two profiles are identical, but as you
can see, dimensions are different.
Relief outline :
For mountains, mountains ranges, wrinkle ridges or domes, an other viewing mode is selected :
___A___
"A" character shows the formation maximum height. The number of "_" characters shows the formation width with the same scale as height.
Rille outline :
For rilles, rilles system and valleys, profile is shown like this :
___ ___
V
"V" character shows the formation maximum depth. The number of "_" characters shows the formation width with the same scale as depth.

The Database window is organized to display formation information extracted from the database. It has a slide bar on the right if not all the data can be displayed in the window.
The version 7 database is the largest existing lunar database to date. The files represent nearly 300 MB of text in French and as much in English! It contains the descriptive files of more than 1 million lunar formations with varying amounts of data depending on the official bases from which they originate.It is separated into eight distinct bases:
- NAMED FORMATIONS : The formations of the visible & hidden faces which have a specific name validated by the UAI (ex: Clavius, Rima Hyginus, Montes Alpes ...): (1,800 entries approximately)
- SATELLITE FORMATIONS: The formations of the visible & hidden faces which do not have a specific name, but a lettered index backed by an official name and which are validated by the UAI (ex: Clavius D, Hyginus A .. .): (Around 7000 entries)
- SALAMUNICCAR UNNAMED FORMATIONS: The formations of the visible & hidden faces which do not have a specific name or an index and which are not validated by the UAI. These are from the work carried out by Goran Salamuniccar of the Faculty of Electrical Engineering and Computing, University of Zagreb and his team (Base LU 78 287) who gave us permission to include them in the VMA (Thanks to him!) . The name of these courses is represented by the LUN (Lunar Universal Number) developed by Christian Legrand specially for the VMA: (approximately 69,600 entries)
- ROBBINS UNNAMED FORMATIONS: The formations of the visible & hidden faces which do not have a specific name or an index and which are not validated by the UAI. These are from the work of Stuart J. Robbins of the Southwest Research Institute (Robbins Lunar Crater Database 2018-08-15) who gave us permission to include them in the AVL (Thanks to him!). The name of these courses is represented by the LUN (Lunar Universal Number) developed by Christian Legrand specially for the AVL: (approximately 1,300,000 entries). This base contains only 4 fields taken from the base of S. J. Robbins so as not to weigh down the display performance of the VMA.
- HISTORICAL SITES : Historical sites on both sides: The sites of all voluntary or accidental impacts of human origin compiled specially for VMA by Christian Legrand (ex: Apollo 15 Base, Ranger 7, Luna 9, Apollo 17 S-IVB, Chang'é, Chandrayann 2 ...) (59 entries)
- PYROCLASTICS FORMATIONS : The list of pyroclastic deposits compiled by Lisa Gaddis and her team (80 entries)
- DOMES: A list of lunar volcanic domes compiled by the members of the ALPO association (700 entries)
- NELIOTA: The list of contemporary meteoritic impacts on the lunar surface listed by the Athens National Observatory as part of the NELIOTA (Near Earth objects Lunar Impacts and Optical TrAnsients) program piloted by the European Space Agency (ESA).
For each formation, available information is :
- the formation name origin.
- the main lunar atlases for amateur astronomers page where to find
the formation.
- the formation location on the lunar disc.
- the formation description.
- various useful information for serious observing.
- official 2012 IAU datas about this formation
Given the mixed sources of the various databases, certain information may not be available in a given database.
Warning : In such detailed work, the data will certainly contain
some mistakes - mainly input mistakes. You can also report them to
Christian Legrand so that he can correct
the database.
The authors thank you in advance for your cooperation. They will be corrected as soon as possible.
Informations of the VMA databases are copyrighted "(c) Christian Legrand" and can't be used outside of the software. For any other use, please contact the author.
DATABASE DETAILED INFORMATION PRESENTATION
You can find more detailed informations about the databases in the DATLUN (c) user's manual, the database manager of VMA.
OFFICIAL NAME :
This field presents the formation main name in Latin used officially
by the International Astronomical Union in capital letters.
In the "Historical sites" database, it's the name of the mission (eg : Apollo 15 Base, Ranger 7, Luna 9, Apollo 17 S IV B...)
For
anonymous craters, the "name" begins with the 3 letters AVL and uses
after the reduced LUN (c) defined below. For domes and pyroclastics
deposits, it's the name in the original database.
LOCAL NAME :
The main name of the formation translated into the language of the program when it exists (Example: Platon / French name for Plato / Official UAI name)
LUNAR UNIVERSAL NUMBER / L.U.N. © :
Here are the LUN description :
The LUN is composed by the assembling of the following characters chain :
XX : 2 letters corresponding tothe “Descriptor
term”
of IAU. These 2 letters are officially used by IAU. Attention, they are
less numerous than the original VMA formations types, so several VMA
types can have the same “descriptor term”.
Here is the official list of IAU Descriptor Terms (Some of them are not used on the Moon presently) :
|
|||||||||||||||||||||||||||||||||||||||||||||||||||||||||||||||||||||||||||||||||||||||||||||||||||||||||||||||
|
|
YYYYYN or YYYYYS
for the digital value of latitude in 1/1000 ° deg. N and S indicate
North or South and are used to deparate latitude and longitude to
clarify the characters chain. The last 3 digits on the right are those
of the 1/1000 ° deg and are always present, even if they are zeros. The
first 2 left digits are absent if the latitude is 00 °.
ZZZZZZ for the digital value of longitude in 1/1000 ° deg. The last 3 digits on the right are those of the 1/1000 ° deg and are always present, even if they are zeros. The first 3 left digits are absent if the longitude is 000 °.
pour la longitude numérique en milliièmes
de degrés comptée vers l’Est jusqu’à 359,999°. Les trois derniers chiffres de
droite pour les milliièmes de degrés sont toujours
présents, même s'ils s'agit de zéros. Les trois premiers chiffres de gauche sont absents si la longitude est de 000°
Here are two examples of LUN (AAYYYYYNZZZZZZ) :
- AA2741S114220 : Crater located at 02,741° South and 114,220°
East
- RI85000N000 : Rill which middle is situated about at 85,00° North et 0,00° East.
Avec all thes features, the LUN is always the shorter possible and it's always easily "readable"
>>>> With the L.U.N. , you can find each lunar formation and this allows you to share observations of this formation with others colleages without any error
LUNAR UNIVERSAL NUMBER / L.U.N. REDUIT © :
For craters, it exists a "Reduced LUN" which is the LUN with the « descriptor term » for craters (AA).
NAME TYPE :
This field contains the category of the type of formation among:
- Named formation
- Satellite training
- Registered formation
- Anonymous formation (not named)
FORMATION TYPE :
This field contains formation type according with tradition or International Astronomical Union, plus some specific additions :
- Cape
- Cliff
- Crater
- Craterlet
- Crater chain
- Dome
- Gulf
- Lake
- Marsh
- Mountain
- Mountains range
- Plain
- Probe
- Rille
- Rilles system
- Sea
- Tray
- Valley
- Walled plain
- Wrinkle ridge
- Wrinkle ridges system
The "Historical site" database contains specific types given that these sites are not officially listed by the International Astronomical Union :
- Human mission / soft landing
- Inert equipment / voluntary impact
- Inert equipment / unvoluntary impact
- Probe / voluntary impact
- Probe / unvoluntary impact
- Probe / soft landing
This field contains the abstract of the type of formation in accordance with the definitions of the International Astronomical Union (Cf "Descriptor term" of the LUN) or traditional plus some specific adaptations:
- TH (Tholus) was chosen to characterize the volcanic domes.
- Pyroclastic deposits have no type of UAI formations that can be applied directly. They have been assigned the added type PD (Pyroclastic deposit).
- "Historical" sites have no type of UAI formation that can be applied directly. They have been assigned the added type HS (Historical Site).
SUB-TYPE:
This field contains categories of types specific to each type of formation (Example: Craterlet / Crater / Plain walled for craters). This field has not yet been fully documented in version 7.
FORMATION PROCESS:
This field contains information on the geological process at the origin of the formation (Example: Meteoritic impact / Extrusive volcanism / Tectonic extension ...)
FORMATION PERIOD :
This field contains information on the lunar geological period which saw the appearance of the formation concerned. This information is for the most part from the "Improved lunar craters database" produced by Charles Byrne, Don E. Wilhelms (USGS) and their team which allow the re-use of this data (Thanks to them).
The 6 periods generally accepted in current literature are:
The Pre-Nectarian: (-4550 MA to -3920 MA)
The Nectarian: (-3920 MA to -3850 MA)
Lower Imbrian: (-3850 MA to -3800 MA)
Upper Imbrian: (-3800 MA to-3200 MA)
The Eratosthenian: (-3200 MA to-1100 MA)
The Copernician: (-1100 MA to the present day)
MA = Millions of years
For some formations, it was not possible to find information concerning the implementation period.
"Formation period not found" is then indicated.
For the "Historical sites" database, the mission launch date is indicated in this field.
SOURCE OF THE FORMATION PERIOD :
This field contains information on the source which cites the probable lunar geological period which saw the appearance of the formation considered. This information is for the most part from the "Improved lunar craters database" produced by Charles Byrne, Don E. Wilhelms (USGS) and their team which allow the reuse of this data.
GEOLOGY :
This field contains interesting geological information on the formation concerned found in various sources.
SIZE :
The following four fields contain data relating to the dimensions of the formations. These vary from source to source. We can therefore find values different from those of other works. Priority was given to data from the International Astronomical Union, then to data from other sources when they seemed plausible. Finally, certain dimensions were directly measured on maps or atlases when they could not be found in the literature. In the "Historic sites" database, these fields are empty.
Dimensions:
This field gives the length in kilometers of the formation and the width. In the case of crater-like formations, the length is in most cases equal to the width since it is in fact the average diameter of the formation.
This field has been revised with the values from the "Improved lunar craters database" produced by Charles Byrne, Don E. Wilhelms (USGS) and their team which allow the reuse of this data. Many thanks to them!
Height :
You find here relative altitudes, not absolute ones referring to the
mean lunar sphere. It gives the formation height when it's known.
For craters, it's the difference between the upper part of the internal slopes and the floor.
For other formations, it's the difference between the formation summit and surrounding land.
For mountains and mountain ranges, it's a mean height and higher summits height is generally detailed in description fields.
For rilles and scarps, it's the difference between surrounding lands
and the formation lower floor.
The field has been revised with the values from the "Improved lunar craters database" produced by Charles Byrne, Don E. Wilhelms (USGS) and their team.
Ratio :
This data is only indicated for formations whose height is known. It's
very often given for craters where it means the diameter / height ratio.
In the case of craters, this field contains information on the size of the bottom of the crater. This information comes from the "Improved lunar craters database" produced by Charles Byrne, Don E. Wilhelms (USGS) and their team.
Height of the central peak:
In the case of craters, this field contains information on the height of the central peak of the crater if it has one. This information comes from the "Improved lunar craters database" produced by Charles Byrne, Don E. Wilhelms (USGS) and their team.
Depth of excavation:
In the case of craters, this field contains information on the difference in altitude between the top of the rampart of the crater and the bottom of it. This information comes from the "Improved lunar craters database" produced by Charles Byrne, Don E. Wilhelms (USGS) and their team.
Impact font thickness:
In the case of craters, this field contains an estimate of the thickness of the rocks melted on impact and which fill the bottom of the crater. This information comes from the "Improved lunar craters database" produced by Charles Byrne, Don E. Wilhelms (USGS) and their team.
Thickness of ejecta at 1 radius away:
In the case of craters, this field contains an estimate of the thickness of the rocks ejected during impact and deposited on the outer slopes of the crater at a distance from the top of the rampart corresponding to a radius of this same crater. This information comes from the "Improved lunar craters database" produced by Charles Byrne, Don E. Wilhelms (USGS) and their team.
Thickness of the ejecta at 3 radii away:
In the case of craters, this field contains an estimate of the thickness of the rocks ejected during impact and deposited on the outer slopes of the crater at a distance from the top of the rampart corresponding to three times the radius of this same crater. This information comes from the "Improved lunar craters database" produced by Charles Byrne, Don E. Wilhelms (USGS) and their team.
Thickness of the ejecta at 5 radii away:
In the case of craters, this field contains an estimate of the thickness of the rocks ejected during impact and deposited on the outer slopes of the crater at a distance from the top of the rampart corresponding to five times the radius of this same crater. This information comes from the "Improved lunar craters database" produced by Charles Byrne, Don E. Wilhelms (USGS) and their team.
Radiant halo radius on radar:
In the case of craters, this field contains an estimate of the radius of the halo giving a brilliant radar image on the immediate periphery of the top of the crater rampart. This information comes from the "Improved lunar craters database" produced by Charles Byrne, Don E. Wilhelms (USGS) and their team.
Radius of the dark halo on radar:
In the case of craters, this field contains an estimate of the radius of the halo giving a dark radar image at the periphery of the crater. This information comes from the "Improved lunar craters database" produced by Charles Byrne, Don E. Wilhelms (USGS) and their team.
DESCRIPTION :
This field is divided in four sections for the formation detailed description.
But this division is not really visible when consulting the
formation form on screen or printing it.
Cardinal points are reference to indicate where the different details are situated according to formation center. For a crater, reference point is the area center.
If observed with naked eye, on the Moon, North is up, South is down,
West is left and East is right.
North
North-West___________________North-East
Formation
center
South-West_____________________South-East
South
For example, a craterlet located on a crater wall down left will be described
as "Walls ridden by a craterlet at South-West".
Craters are the most numerous formations. Their description is well divided in four parts.
General description
First, information about shape, location and preservation of the formation.
External slopes description
Then, the external "slopes" are described. Generally, the comments are about their inclination. If radial valleys are present, slopes are described as "tormented". This part also indicates craters and craterlets situated on external slopes.
Internal walls description
The "walls" which are described are the internal ones. They link the upper rim of the slopes to the crater floor. The walls are described as "little high when the altitude difference is less than 2,000 m, "pretty high" between 2,000 and 3,000 m, "high" between 3,000 and 4,000 m and "very high" if more than 4,000 m. The indicated information is that which seem the most believable according to important variations in different bibliographical sources. This part also indicates craters and craterlets situated on internal slopes.
Crater floor
The crater "floor" is described as "flat" if no hills can be found to
"tormented" if it's very irregular. The non circular shape is
mentioned. If lava seems to have flooded the crater floor, it has been
indicated. This part also indicates craters and craterlets situated on
the floor.
Historical sites
In the "Historical sites" database, specific descriptions includes :
- Launch date and hour
- Astronauts names for a human mission
- Probe or spaceship description
- Mission main phases dates and hours
- Scientific results
ELGER DESCRIPTION DE ELGER
This field contains the description of the formation as it has been published by Thomas Gwynn Elger in his book "THE MOON, A FULL DESCRIPTION AND MAP OF ITS PRINCIPAL PHYSICAL FEATURES" released in 1895. All formations aren't described in this book. This description contains often interesting observational details.
Interest :
This field will help you to determine which formations to observe. It
gives you information on the formation interest. It has been defined by
the authors according to their own experience. Sure, you can disagree
with them.
Formations are indicated as :
- Low interest formation
- Pretty interesting formation
- Very interesting formation
- Exceptionally interesting formation
Lunar month day for evening observation :
This expression means "Day of lunar month permitting an evening observation of the formation". It has been observed that Eastern limb formations can only be well observed 2 days after New Moon.
The indicated day is the one for a null libration. It has been computed
from formation longitude. According of the real libration value, it can
be shifted by one day more or less.
Lunar month day for morning observation :
This expression means "Day of lunar month permitting an morning observation of the formation". It has been observed that Western limb formations can only be well observed 2 days before New Moon.
The indicated day is the one for a null libration. It has been computed
from formation longitude. According of the real libration value, it can
be shifted by one day more or less.
Useful
instrument :
This field presents the smallest instrument needed to comfortably observe the formation. It has been computed from the formation width and from practical resolution power (PRP) of the instruments defined as the double of TRP. It is supposed to be obtained when using a magnification equal to instrument diameter in centimeters.
This data is provided for a Moon mean distance of 202,000 miles. An arc second is then about 1 mile on the Moon.
This data depends on other external criteria such as instrument quality, observer's eye health, seeing...).
- Naked eye (PRP = 10O miles)
- x10 binoculars (PRP = 20 miles)
- 2" refractor (PRP = 5 miles)
- 4" reflector (PRP = 2.5 miles)
- 6" reflector (PRP = 1.6 miles)
- 8" reflector (PRP = 1.2 miles)
- 10" reflector (PRP = 1 mile)
- 12" reflector (PRP = 0.8 mile)
POSITION :
Longitude :
You can find here the selenographic longitude of the formation with a
tenth of degree precision. This data is provided by International Astronomical
Union. Longitude is negative to the West of central meridian. About craters,
it's the center longitude. For lengthened or irregular formations, it's
an internal point the closest to central.
Latitude :
You can find here the selenographic latitude of the formation with a tenth of degree precision. This data is provided by International Astronomical Union. Latitude is negative to the South of lunar Equator. About craters, it's the center longitude. For lengthened or irregular formations, it's an internal point the closest to central.
Quadrant :
Information has been included to make easier the location of the formation on the lunar disk. The location system is that of the International Astronomical Union since 1988. When you look at the lunar disk with the naked eye, the North is up and the East is right.
This first field indicates the lunar quadrant where is situated the formation according to the "Lunar Quadrant Charts" by Arthur and Agnieray published by the University of Arizona :
- North-East
- South-East
- North-West
- South-East
Area :
This field indicates clearly the lunar region where can be found the
formation according to a more known one (sea, mountain or large crater)
or according to the position on the edge of the lunar disk (limb) or according
to the center of the lunar disk.
ATLAS :
This field contains pages, maps or picture of the main paper atlases presently available on which the selected formation is indicated.
Rükl :
In honor to its author for his contribution to Astronomy popularization,
we have mentioned the map number of the "Atlas of the Moon" by Antonin
Rükl on which is found the formation.
Viscardy :
Also in honor to its author for his contribution to Astronomy popularization,
we have also mentioned the page number of the "Photographic Atlas of the
Moon" by Georges Viscardy on which the formation is found with a text
on it, or on which a photograph shows the place where is situated the
formation.
For this last work, when the formation does not figure on at least
one photograph, there is no page indicated. Similarly, if the formation
appears on, at least, a photograph, but is not described in the text,
it is the page of the best photograph where it is normally visible that
is indicated.
Hatfield :
In honor to its author for his contribution to Astronomy popularization,
we have mentioned the map number of the "Hatfield Atlas of the Moon" republished
by Jeremy Cook on which the formation is found.
Westfall :
In honor to its author for his unique work, we have mentioned the maps numbers of the "Atlas of the Lunar Terminator" from Professor John E. Westfall on which the formation is found, because it's the only one that shows all librations variations.
Wood :
We mentioned Charles Wood's articles on numerous formations
edited in Sky and Telescope and the number of his "Lunar
100 list", with his courtesy.
LOPAM :
Adding to downloadable picture of the LOPAM, we have indicated numbers of "Lunar Orbiter Photographic Atlas of the Moon" pages on which you can find the selected formation. Just click on this link and go to the Internet site of Jeff Gillis of Lunar and Planetary Institute and you will admire the entire picture from which was extracted the picture.
Nevertheless, if you are not permanently connected to the Internet, another possibility is offered.
NAME ORIGIN :
Real name :
This field presents the real name of the person whose name has been given to the formation. When it also exists, a nickname is indicated between parentheses.
For other formations than craters, the official name is first translated
in English, and then you can find the real name of the person whose
name has been given to the formation.
Works :
This field indicates, for craters, the activities of the person whose
name has been given to the formation.
Here is the list of the"works" you can find in the database:
- Agronomist
- Alchemist
- Admiral
- Anthropologist
- Archaeologist
- Archbishop
- Architect
- Artist
- Astronaut
- Astronomer
- Astrophysicist
- Aviator
- Banker
- Biologist
- Botanist
- Calif
- Cartographer
- Chemist
- Clockwork
- Consul
- Cosmographer
- Egyptologist
- Engineer
- Engraver
- Explorer
- Geodesist
- Geographer
- Geologist
- Geometer
- Geophysicist
- God
- Hero
- Historian
- Humanistic
- Hydrographer
- Inventor
- Jurist
- King
- Manufacturer
- Mathematician
- Meteorologist
- Mineralogist
- Missionary
- Mythological fame
- Naturalist
- Navigator
- Oceanographer
- Optician
- Paleontologist
- Pharmacist
- Philologist
- Philosopher
- Physicist
- Physiologist
- Poet
- Political man
- Priest
- Printer
- Professor
- Scientist
- Sailor
- Saint
- Sismologist
- Sponsor
- Stateman
- Technician
- Theologian
- Writer
- Zoologist
Please note that some people have been credited with 2 or 3 works.
Nation :
This field indicates the nationality generally attributed to the person whose name has been given to the formation. It can be the birth nationality. You can also find nationalities no longer in existence.
Here is the list of nationalities present in the database:
- American
- Arabian
- Australian
- Austrian
- Babylonian
- Belgian
- British
- Byzantine
- Brazilian
- Canadian
- Carthaginian
- Castillan
- Chinese
- Cretian
- Dalmatian
- Danish
- Dutch
- Egyptian
- English
- Finnish
- French
- Greek
- German
- Hungarian
- Indian
- Irish
- Italian
- Japanese
- Jewish
- Macedonian
- Mexican
- Norwegian
- Persian
- Polish
- Portuguese
- Roman
- Russian
- Scottish
- Soviet
- South African
- Spanish
- Swedish
- Swiss
- Czech
- Venetian
Birth place :
This field indicates the birth place of the person whose name has been
given to the formation when it has been possible to find it. If not found,
it is indicated " ? ". Please note that for imaginary persons, there
is no birth place.
Birth year :
This field indicates the birth year of the person whose name has been
given to the formation if it has been possible to find it. If not found,
it is indicated " ? ". Please note that for imaginary persons, there is no
birth year.
Death place :
This field indicates the place of death for the person whose name has been given to the formation when it has been possible to find it. If not found, it is indicated " ? ". Please note that for imaginary persons, there is no place of death.
Death year :
This field indicates the year of death for the person whose name has
been given to the formation if it has been possible to find it. If not
found, it is indicated " ? ". Please note that for imaginary persons, there
is no year of death.
Prominent facts :
This field describes prominent facts during the life of the person whose name has been given to the formation if it has been possible to find it. If not found, it has been indicated " ?? " .
This information is adapted from information given by the International Astronomical Union, and additional data coming from various bibliographical sources.
Generally, you can find the discoveries, inventions and important works attributed to the person, as well as distinctions obtained during life (nominations, price. ..) with associated dates when they have been found.
Name author :
This field indicates, when it's known or supposed, the organization or
person name that has given the name to the formation. Also included in
this chapter is the year of nomination when it has been found. In this
paragraph, IAU means" International Astronomical Union ". You can find
mainly 3 origins:
- Hevelius
- Riccioli
- IAU
When the origin has not been found, the field contains (??). Additionally, some uncertain origins end with "?".
These name origins are purely indicative and are not to be held as rigorously exact because of numerous additions made during all periods to the lunar nomenclature.
In the "Historical sites" base, it's the country and the agency which conceived the mission that are indicated.
Name given by Langrenus:
This field indicates the name given by Michel Florent Van Langren on his Moon map in 1644. When the formation has not received a name, "Not named" is indicated.
Name given by Hevelius :
This field indicates the name given by Johannes Hevelius on his Moon map in 1647. When the formation has not received a name, "Not named" is indicated.
Name given by Riccioli :
This field indicates the name given by Riccioli on the Moon map drawn in 1651 by Francesco Grimaldi. When the formation has not received a name, "Not named" is indicated.
Official name given by IAU to the formation with all the additives on letters (Accents, tilde, etc...) as they have been given to the honored character.INTERNATIONAL ASTRONOMICAL UNION DATAS
IAU Feature Name :
It's official IAU name above without all the additives on letters (Accents, tilde, etc...)
so that they can be managed internationally by computers.
IAU Diameter
Approximate diameter or biggest dimension in kilometers.Latitude of the center of the formation. Positive numbers indicates that the formation is localized in northern hemisphere and negative numbers indicate that the formation is localized in the southern hemisphere.
Longitude of the center of the formation. On the Moon, positive numbers indicates longitudes towards East and negative numbers indicate longitudes towards West.
Latitude the most on North of the formation. Positive numbers indicates that the formation is localized in northern hemisphere and negative numbers indicate that the formation is localized in the southern hemisphere.
Latitude the most on South of the formation. Positive numbers indicates that the formation is localized in northern hemisphere and negative numbers indicate that the formation is localized in the southern hemisphere.
Longitude the most on the East of the formation. On the Moon, positive numbers indicates longitudes towards East and negative numbers indicate longitudes towards West.
Longitude the most on the West of the formation. On the Moon, positive numbers indicates longitudes towards East and negative numbers indicate longitudes towards West.
Coordinates system used for latitudes and longitudes. For the Moon, it's planetographic with east longitudes as positive and counted from 0 to -180° and from 0 to 180° from the meridian 0. It's ULCN 2005(Unified lunar coordinates network de 2005). Mean lunar sphere is considered withe a radius of 1737,4 km
Continent or great geographic divisin associated to the name.
Africa (AF)
Antarctica (AN)
Asia (AS)
Europe (EU)
North America (NA)
Oceania (OC)
South and Central America (SA)
Ethnic or cultural or nationalty associated to the name.
AFRICA
| Algeria | AL |
| Angola | AN |
| Bantu | BA |
| Benin | BE |
| Botswana | BT |
| Burkina Faso (Upper Volta) | BF |
| Burundi | BR |
| Bushman | BU |
| Bushongo | BH |
| Cameroon | CR |
| Canary Is. | CI |
| Dahomean | DH |
| Egypt | EG |
| Ethiopia | ET |
| Gabon | GB |
| Gambia | GA |
| Ghana | GH |
| Gold Coast | GC |
| Guinea | GU |
| Hottentot | HO |
| Ivory Coast | IC |
| Kenya | KY |
| Lesotho | LE |
| Liberia | LI |
| Libya | LB |
| Madagascar | MD |
| Malawi | MW |
| Mali | ML |
| Mande | MN |
| Mauritania | MU |
| Mauritius | MA |
| Mbundu | MB |
| Mende | ME |
| Morocco | MR |
| Mozambique | MZ |
| Namibia | NM |
| Niger | NG |
| Nigeria | NI |
| Pygmy | PY |
| Republic of Chad | CH |
| Republic of Seychelles | SY |
| Rwanda | RW |
| Semitic | SE |
| Senegal | SN |
| Sierra Leone | SL |
| Somalia | SO |
| South Africa | SA |
| Sudan | SU |
| Swaziland | SW |
| Tanzania | TA |
| Togo | TO |
| Tunisia | TN |
| Uganda | UG |
| Unknown | -- |
| Yao | YA |
| Zaire | ZA |
| Zambia | ZM |
| Zimbabwe | ZI |
| Zulu | ZU |
ASIA
| Afghanistan | AF |
| Akkadian (Accadian) | AK |
| Altai | AL |
| Arabian | AR |
| Armenian | AM |
| Assyrian | AY |
| Assyro-Babylonian | AB |
| Azerbaijan | AZ |
| Babylon | BY |
| Bangladesh | BA |
| Bhutan | BH |
| Buriat | BR |
| Burma | BU |
| Cambodia | CM |
| China | CH |
| Chukchi | CU |
| Elamite | EL |
| Evenki | EV |
| Georgia | GE |
| Hebrew | HE |
| Hindu | HI |
| India | IN |
| Indonesia | ID |
| Iran | IR |
| Iraq | IQ |
| Israel | IS |
| Itelmen | IT |
| Japan | JA |
| Jewish | JW |
| Jordan | JO |
| Kashmir | KA |
| Kazakhstan | KZ |
| Ket | KT |
| Korea | KR |
| Kuwait | KU |
| Kyrgyzstan | KY |
| Laos | LA |
| Lebanon | LE |
| Malaysia | MA |
| Mansi | MS |
| Mesopotamian | ME |
| Minyong | MY |
| Mongolia | MO |
| Monguor | MG |
| Nanai | NA |
| Neghidhian | NG |
| Nepal | NE |
| Nganasan | NS |
| Oman | OM |
| Ostyak | OS |
| Pakistan | PK |
| Persian | PE |
| Philippines | PH |
| Phoenician | PO |
| Sanskrit | SA |
| Saudi Arabia | SB |
| Scythian | SC |
| Semitic | SE |
| Siberia | SI |
| Sri Lanka | SR |
| Sumerian | SU |
| Syria | SY |
| Taiwan | TW |
| Tajik | TJ |
| Thailand | TH |
| Tibet | TB |
| Tungu | TN |
| Turkey | TU |
| Turkmenistan | TK |
| Tuva | TV |
| Ulci | UL |
| Unknown | -- |
| Urartu | UR |
| Uzbekistan | UZ |
| Vietnam | VT |
| Yakutian | YK |
| Yemen | YE |
EUROPA
| Albania | AL |
| Andorra | AN |
| Austria | AS |
| Bashkir | BS |
| Belarus | BL |
| Belgium | BE |
| Bosnia-Herzegovina | BH |
| Bulgaria | BU |
| Byzantine | BZ |
| Caucasus | CC |
| Celtic | CE |
| Chuvash | CH |
| Croatia | CR |
| Cyprus | CY |
| Czechoslovakia | CZ |
| Denmark | DE |
| England | EN |
| Eskimo (Greenland) | EK |
| Estonia | ES |
| Finland | FI |
| Flemish | FL |
| France | FR |
| Germany | GE |
| Great Britain | GB |
| Greek | GR |
| Greenland | GL |
| Gypsy | GY |
| Hungary | HU |
| Iceland | IC |
| Ireland | IR |
| Italy | IT |
| Kalmyk | KL |
| Karelia | KA |
| Komi | KO |
| Lapp | LP |
| Latin | LA |
| Latvia | LV |
| Liechtenstein | LE |
| Lithuania | LI |
| Luxembourg | LU |
| Macedonian | MA |
| Malta | ML |
| Mari | MR |
| Moldova | MD |
| Mordvinian | MO |
| Netherlands (Dutch) | DU |
| Norse | NS |
| Norway | NO |
| Oscan | OS |
| Ostrogoth | OG |
| Poland | PO |
| Portugal | PG |
| Roman | RM |
| Romania (Rumania) | RO |
| Russia | RU |
| Scandinavian | SD |
| Scotland | SC |
| Scythia | SY |
| Slavic | SL |
| Slovakia | SV |
| Slovenia | SI |
| Soviet | SO |
| Spain | SP |
| Sweden | SW |
| Switzerland | SZ |
| Tartar | TT |
| Teutonic | TU |
| Udmurtian | UD |
| Ukraine | UK |
| Unknown | -- |
| Wales | WA |
| Yugoslavia | YU |
NORTH AMERICA
| Aleutian | AU |
| Algonquin | AL |
| American | AM |
| Arikara | AR |
| Blackfoot | BL |
| Canada | CA |
| Cherokee | CE |
| Cheyenne | CY |
| Chickasaw | CH |
| Chinook | CI |
| Choktaw | CO |
| Chumash | CU |
| Creek | CR |
| Dakota | DA |
| Dominica | DO |
| Eskimo | ES |
| Hopi | HO |
| Iroquois | IR |
| Klamath | KL |
| Lakota | LA |
| Mandan | MA |
| Mexico | ME |
| Navajo | NV |
| Osage | OS |
| Pawnee | PW |
| Pequot | PE |
| Potawatomi | PO |
| Pueblo | PU |
| Salish | SA |
| Seneca | SE |
| Shoshoni | SH |
| Sioux | SX |
| Tlingit | TL |
| United States | US |
| Unknown | -- |
| Zuni | ZU |
OCEANIA
| Australia | AU |
| Caroline Is. | CI |
| Cook Islands | CO |
| Fiji | FJ |
| Guam | GM |
| Hawaii | HA |
| Marquesas Islands | MA |
| Marshall Is. | MI |
| Melanesia | ME |
| Micronesia | MC |
| Nauru | NA |
| New Britain | NB |
| New Guinea | GU |
| New Zealand | NZ |
| Papua New Guinea | PN |
| Polynesia | PO |
| Republic of Palau | PA |
| Samoa | SA |
| Society Is. | SI |
| Toamotu | TU |
| Tonga | TO |
| Unknown | -- |
| Vanuatu | VA |
CENTRAL AND SOUTH AMERICA
| Argentina | AR |
| Auracanian | AC |
| Aztec | AZ |
| Barbados | BB |
| Bolivia | BO |
| Bororo | RR |
| Brazil | BR |
| Chile | CH |
| Chimalateco | CI |
| Colombia | CO |
| Costa Rica | CR |
| Cuba | CU |
| Dominican Republic | DR |
| Ecuador | EC |
| El Salvador | ES |
| Falkland Islands | FI |
| French Guiana | FG |
| Grenada | GR |
| Guatemala | GU |
| Guyana | GY |
| Haiti | HA |
| Honduras | HO |
| Inca | IN |
| Jamaica | JM |
| Mayan | MY |
| Nahuatl | NA |
| Netherland (Dutch) Antilles | DA |
| Nicaragua | NI |
| Panama | PM |
| Paraguay | PA |
| Peru | PE |
| Puerto Rico | PR |
| Suriname | SU |
| Unknown | -- |
| Uruguay | UR |
| Venezuela | VE |
| Virgin Islands | VI |
Code in two letters of the IAU descriptor term (cf Lunar Universal Number above)
Specific quadrant where is localized the formation center.
Two letters code of the specific quadrant where the formation center is localized.
Approval level of the formation in 2011.
| 1 | Proposed (not currently used) | |
| 2 | Task Group approval (not currently used) | |
| 3 | WGPSN approval (not currently used) | |
| 4 | Executive Committee approval (not currently used) | |
| 5 | Adopted by IAU | |
| 6 | Dropped, no longer in use | |
| 7 | Never approved by the IAU |
Date when the name has been approved by IAU. Complete dates begin at half september 2006 and are recorded as (YYYY-MM-DD).
Reference book from where the origin and the orthograph of the name are given.
Short explanation of the formation name.
When you click on the "Ephemeris" tab, the right frame window fills with Moon sky and orbit position data: This position can be set entering some parameters. You can also continuously manage time with the "tape recorder" buttons.

DATE AND TIME INPUT
Observation date and hour can be set with upper case, either clicking
and entering them directly or using the arrows. The "Compute"
button displays the map with the choosen date and hour.
The "Now" button can show directly the Moon aspect at the current time. Date and hour used are those of your operating system. Verify if it's on time. This setting is very useful when using the software "in the field".
The "Compute" button display the Moon as it looks like to the date and hour selected with the previous paragraph.
The "Oh" button shows you the Moon at 0 h on the date
selected with the previous paragraph.
"VIDEO RECORDER" BUTTONS
"Video recorder" buttons are a powerful provision meant for real Moon aspect changes. They are very useful when using Open gL 3D display with the "Phase" and "Lib ration" options activated.

">>" and "<<" buttons can increase or decrease date with
a one day rate. ">" and "<" buttons increase or decrease hour with
a one hour rate.
These buttons allow you to observe the phase and librations evolution during time. They can be used to detect best observing periods of formations which are near or inside the librations zones.
"PHASES CALENDAR"

This is a tool to help you for preparing next observing sessions. This part of the frame shows you a Moon phases calendar. It contains the next four phases. But, with the white arrows, you can navigate in the list and retrieve old or future phases dates.

The right frame window contains the following information on Moon position
:
Moon right ascension
Moon declination
Distance :
Apparent diameter:
Phase angle
Lunation day
Illumination percentage
Solar inclination
Latitude libration value
Longitude libration value
Maximum libration position on limb
Moon rise hour
Moon meridian transit hour
Moon set hour
Moon rise azimuth
Moon set azimuth
The following informations are not displayed if you check the box "Geocentric
coordinates" in the "General" tab of the
"Configuration" menu.
Moon rise hour
Moon meridian transit hour
Moon set hour
Moon rise azimuth
Moon set azimuth

This option can list in the right frame window, a list of formations
visible along the terminator according to date selected in the "Ephemeris tab". And more, you can extract and sort these formations using
some choices.
"INTEREST" SCROLLING LIST
You can set with the scrolling list "Interest" a filter for limiting
your choice. You can choose between :
- All the formations
- The pretty interesting formations
- The very interesting formations
- The exceptional formations (The best ones)
"INSTRUMENT" SCROLLING LIST
A second filter can be set to limit the listed formations to those which are visible in a given instrument (See "Useful instruments "). You can choose this one in the scrolling list. "999" doesn't limit the list (No applied filter).
You can see that most of the formations can yet be observable in a 100
mm (4 ") instrument.
"SORT" BUTTONS

These selections choose the presentation mode of the extracted formations list
- Name
Clicking this point sorts formations by alphabetical order
- Latitude
Clicking this point sorts formations by latitude from equator to North pole and then, from equator to South pole.
- Interest
Clicking this point sorts formations by interest.
- Instrument
Clicking this point sorts formations by instrument capability
THE "NOTES" TAB

It's in this tab that you can input all your notes written during an observation of the selected formation. Each formation has its "notes sheet" waiting your commentaries. These are stored in a personal special dtabase.
The "Update" button is used to input the notes you have just written in the database. Don't forget to click it or your notes will be lost, but ther is a security window before closing the "Notes" tab.
THE "TOOLS" TAB
"Tools" tab in "Telescope"
mode
"Normal mode / Distance measure" BUTTON
This button changes cursor action mode on the map. It's a toggle button. Its caption changes to allow you to go back to the other mode.
"Normal mode"
When in normal mode, the cursor is like a round bull's eye and is used to select formations.
"Distance measure"

When in this second mode, the cursor changes its shape and is used for measuring distances between lunar formations or for measuring dimensions of a selected formation.
Put the cursor on the beginning of the distance to measure. Click with the left button and hold it down. Move the mouse. A color line originating at the first point appears. You just have to go to the end of the distance you want to measure by moving the mouse. Once there, release the mouse button. The line stays visible.
Up in the "Tools" panel, a box indicates the length of the drawn line in km and in arc minutes. Spherical shape of the Moon in included in the computing method. So, near the lunar limb, two perpendiculars lines with the same apparent length will indicate different dimensions.
You can turn the map so that it matches what you are observing through the eyepiece of a Newtonian telescope.

When clicking the "East" or "West" button, you rotate
the map display with a slight angle in the choosen direction.
"Mirror" BOX
When you select this box and the "North" box together, the Moon map will show you what you will see in an instrument as a refractor or catadioptric reflector as Cassegrain, Schmidt-Cassegrain or Maksutov telescope.
When you select the box "Local Zénith up", the Moon drawing will be that you can observe in an instrument on an altazimutal mount. You will have to check also the "Mirror" box if your instrument is a refractor or a

"Telescope" Frame
This frame allows you to setup your "Goto" mount.

If you own a such computerized mount which accepts the ASCOM protocol,
the Virtual Atlas of the Moon will track it directly on the Moon.
First of all be sure that you have installed the good ASCOM drivers on
your computer. If not, go on the internet to the site
to download them. Install them.
Connect your mount to your computer. Start your computer and the version
of the software.
First initialize tour telscope as usually, then use the pad or a planetarium
software to point the Moon.
Click on the "Show menu" button and launch the connection.
Begin centering a well known formation in the eyepiece fieeld and select
it on the map. Push the "Sync selection" button for initializing
telescope coordinates on this position.
It's also possible to make this operation on a star near the Moon with
the planetarium program.
After, check the box "Track position" so that the map
displays always the telescope position.
If your telescope can do automatic pointing, you can now click on a formation
on the map, or choose it with the "Search" function of
the "Information" tab and then click on the "Goto
selected" button
If you check the "Correct the Moon motion" box, you
can choose the period correction with the choice box below.
"Orbit the Moon" Frame

This frame can simulate the view you should have from a spaceship orbiting around the Moon.
Choose the automatic rotationspeed in the scrolling list.
"<" et ">" buttons allows you to choose the rotation direction.
" II " button stops the automatic rotation.
"East view", "Center" et "West view" buttons send you to the Moon Equator on the East or West limb or on the center of the Moon disk.
Names display is only effective when rotation is stopped.
"Orbit altitude" can be choosen from 100 to 2000 km by moving the cursor.
"Orbit inclination" compared to the lunar equator can be choosen from 0° (on the equator) to 90° (Passing on the two poles). The negative side of the cursor gives retrograde motion.

Above : Copernicus rise simulation
THE "SETTINGS" TAB
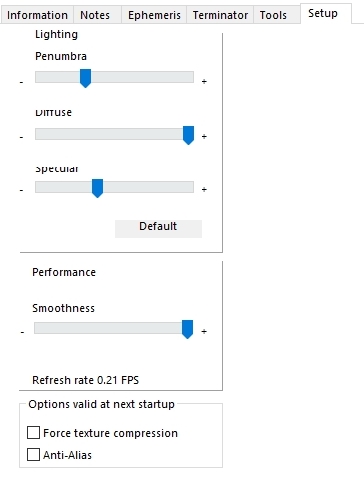
This tab will allow you to choose the special settings for the display.
"PENUMBRA" CURSOR
This cursor sets the transparence of the "night" part of the Moon globe when the box " when the "Show the phase" box in the "Display" tab of the "Configuration" menu is activated. We think it's better to choose an intermediate setting to give an "Ashen Light" appearance to the rest of the globe. Cursor at left gives a night part completely black. But if you want to use VMA as an atlas, put the the cursor to right or uncheck the "Show the phase" box in the "Display" tab of the "Configuration" menu
"DIFFUSE" CURSOR
This cursor sets the general quality of the map.
"DIRECT" CURSOR
This cursor manages the transition zone between light and shadow width.
At left, it's maximal but not too realist. Ce curseur sert à gérer
la largeur de la zone de transition entre la partie éclairé
et la partie nocturne de la face visible. Complètement à
gauche, cette largeur est minimale. A droite, la transition est maximale,
mais peu réaliste. Il vous est conseiller d'adopter un réglage
intermédiaire.
"RESOLUTION" CURSOR
This cursor manages the 3D sphere when textures is applied precision.
At left, it's not a sphere but a rough polyedra with visible flat faces.
Moving the cursor at right increases the faces number, but this needs
a more powerful computer.
An image number indicator (fps) shows you the performance of your configuration.
Don't go under 4 fps to keep a sufficiently speedy display when handling
the map.
But, going to a better spherical resolution also slightly increases the
formations place precision on the map.
"OPEN GL INFO" BUTTON
This button displays a window giving informations on your graphic card. Use it to know what options are available on your compuuter and to check if it workw well.
"OPTIONS VALID AT NEXT STARTUP" FRAME
As indicated , changing one of the following options will be taken account only at next computer startup.
"Force texture compression" :
Normally, this option must be checked to avoid display flickering. Removing
it can nevertheless improve performances with some graphic cards types.
"Anti Alias" :
Try this option to remove scale effects on map window. Beware, only some
graphic cards can handle this option.
THE SEARCH ZONE
THE "TYPING SEARCH ZONE"

Elle vous permet de chercher de nouvelles formations en y entrant leur nom ou de resélectionner une formation recherchée récemment. Vous pouvez entrer dans cette liste des lettres figurant dans le nom d'une formation et employer des "jokers". Ainsi, "*tri*" inclura dans la liste déroulante "Triesnecker" et "Rimae Triesnecker"
THE "FIND" BUTTON
When
you click on this button, you display the first formation
alphabetically corresponding to the search criteria choosen in the
"Search" field".
THE "NEXT" BUTTON
When you click on this button, you display
the next formation alphabetically corresponding to the search criteria
choosen in the "Search" field".
THE STATUS BAR

"COORDINATES" DISPLAYS
Latitude and longitude of the pointer on the moon globe are displayed on the left side of the status bar. Don't mix them with your observing site coordinates
"DATE AND HOUR" DISPLAY
The date and time in the status bar corresponds to the time selected in the "Ephemeris" tab. It should not be confused with the date and time of your system!!!
"FIELD" DISPLAY
The field value corresponds to the visual apparent field of the map window selected.
"TEXTURE AND OVERLAY" DISPLAY
The used texture and its definition level, and the overlay eventually used are clearly indicated in the status bar.
END OF ATLUN MODULE MANUAL OF THE VMA 7
(This english version has been partially corrected by Jim Gartner. Thanks, Jim for your help !)
The authors thank in adavance users to inform them about every mistake encountered in this manual in using the VMA Internet site forum.
Copyright Christian Legrand
&